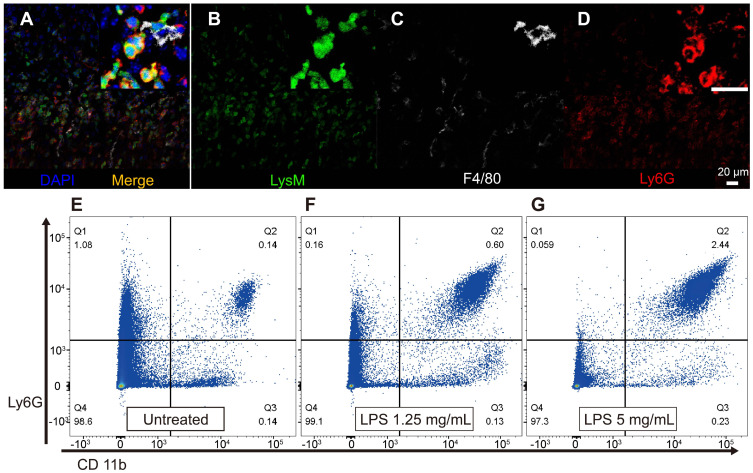
Figure 5.
Infiltrated LysM-GFP positive cells in the cochlear lateral wall 2 days after LPS inoculation are mainly neutrophils and the number of neutrophils increases in proportion to LPS concentration. Immunohistochemistry was performed with cell-specific markers, and a magnified image is located in the upper right corner of each image. (A-D) The merged image (A) shows LysM-GFP positive cells in green (B), F4/80-positive cells in white (C), and Ly6G-positive cells in red (D). Blue, DAPI. (E-G) Flow cytometry was performed with a different LPS dose, such as untreated control (E), LPS concentration of 1.25 mg/mL (F), and LPS concentration of 5 mg/mL (G). The y-axis represents the fluorescence intensity of Ly6G, and the x-axis represents the fluorescence intensity of CD11b. Cells in the Q2 area (Ly6G+, CD11b+) were defined as neutrophils. Scale bar = 20 µm.

