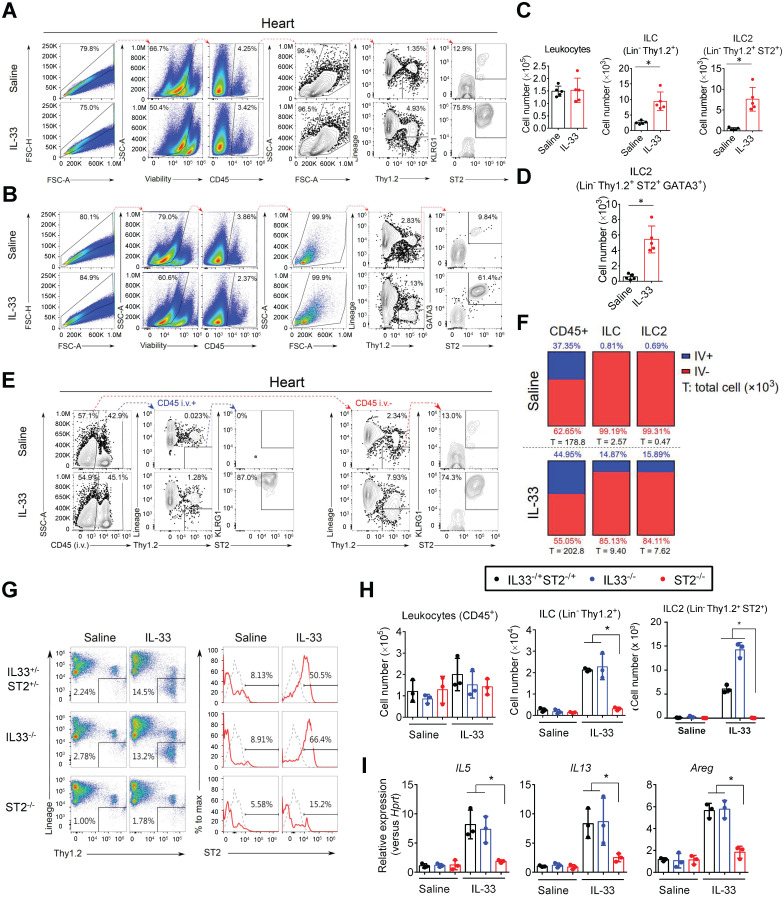
Figure 1.
Identification and characterization of the cardiac resident ILC2 population. Wild-type C57BL/6J mice were intraperitoneally injected with Saline or IL-33 (2 μg/mouse for 5 consecutive days). The heart tissues were collected for flow cytometry analyses of ILC2 population surface markers and transcription factors. (A) Representative plots and gating strategy for ILC (CD45+Lin-Thy1.2+) and ILC2 population (CD45+Lin-Thy1.2+ST2+) identification in mouse heart cells. (B) Representative plots for characterization of GATA3 expression in mouse cardiac ILC2s. Lineage markers (CD3, CD19, FcεRI, CD11c, CD11b, F4/80, and CD49b) were used in the flow cytometry. (C) Total number of CD45+ leukocytes, ILC, ST2+ ILC2, and (D) GATA3+ ILC2 in the heart (n = 5 per group). (E) Anti-CD45 antibody were i.v. administered into saline- or IL-33-injected mice 3 minutes before hearts were harvested. Intravascular (CD45 i.v.+; blue arrows) and interstitial (CD45 i.v. -; red arrows) ILC (Lin-Thy1.2+) and ILC2 (Lin-Thy1.2+ST2+) were determined by flow cytometry. (F) Proportion of intravascular (IV+, blue) and interstitial (IV-, red) CD45+ leukocytes (left), Lin-Thy1.2+ ILC (middle), and Lin-Thy1.2+ST2+ ILC2 (right) in mouse hearts. The percentage are indicated inside the bars; the numbers below the bars represent the total number of each population in the heart (x 103). Each panel shows the representative data from two independent experiments (n = 5 per group). (G) Representative plots and gating strategy for ILC2 population identification in hearts from saline or IL-33-treated ST2‒/‒, IL33‒/‒, and IL33-/+ST2-/+ heterozygote littermates. Dashed lines indicate the isotype control, and solid red lines indicate the ST2 signal intensity. Data are representative of three independent experiments. (H) Total cell number of leukocytes, ILC, and ILC2s in the cardiac tissues (n = 3 in each group). (I) The heart tissues were harvested and the mRNA were isolated for qRT-PCR analysis of gene expression (n = 3 in each group). *P < 0.05 by one-way ANOVA followed by the Bonferroni multiple comparison post-hoc test. All values are means ± SD. Each dot indicates a biological replicate.

