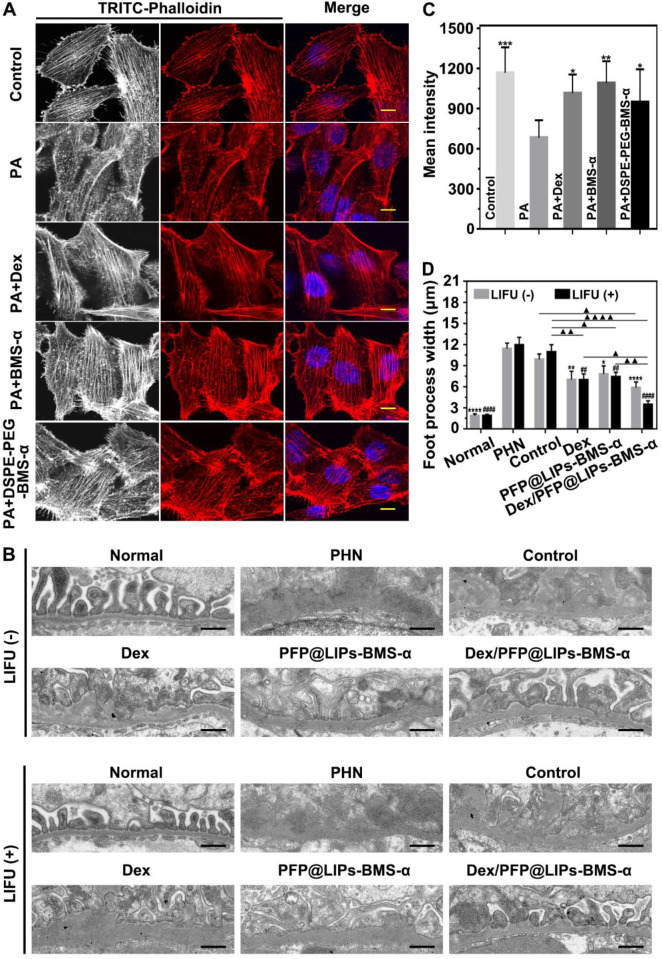
Figure 7.
Restoration of stress fibers after injury, and post-treatment evaluation according to the morphology of podocytes by TEM after various treatment in vivo. (A) Stress fibers of human kidney podocytes were observed by CLSM after different treatment, including control, PA, PA + BMS-α and PA + DSPE-PEG-BMS-α. Red, black and white were the stress fibers, the nuclei were stained blue, scale bar = 10 µm. (B) The morphology of PHN rats' kidney podocytes were observed by TEM after 4 weeks of various treatment, and with LIFU or without LIFU. Saline was used as the control group, PHN model rats as the PHN groups, scale bar = 6 µm. (C). The mean fluorescence intensities were measured by a semi-quantitative method to evaluate restoration of stress fibers after injury, data are presented as mean ± SD, one-way ANOVA, *P < 0.05, ***P < 0.001, vs. PA group. (D) Quantitative analysis of the foot process width by Image J, data are presented as mean ± SD, one-way ANOVA, */#P < 0.05, ****/####P < 0.0001, vs. control group.

