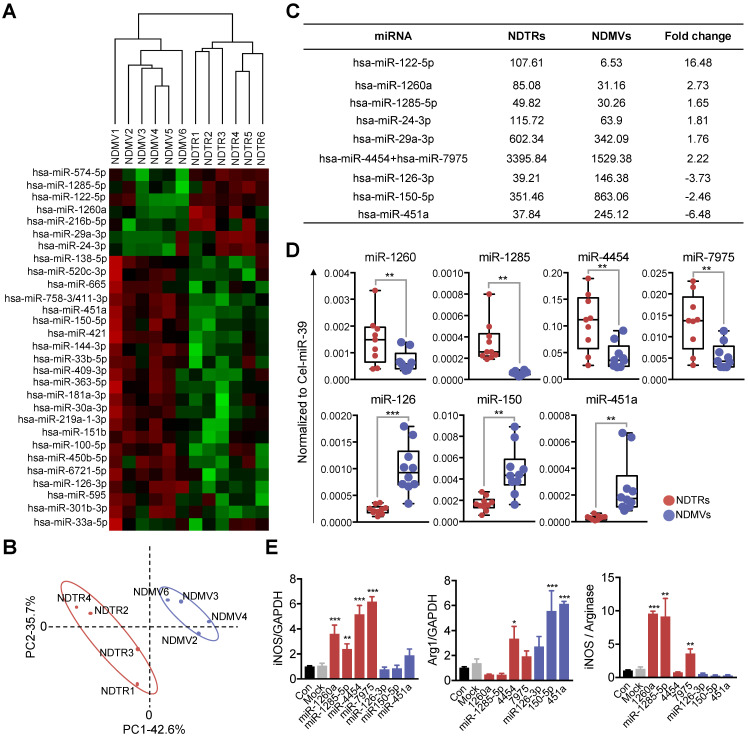
Figure 5.
Proinflammatory miRNA profiles in NDTRs. (A) Hierarchical clustering of differentially expressed miRNAs in NDTRs and NDMVs. The miRNA profiles of NDTRs and NDMVs (n = 6 per group) clustered. Cluster analysis based on log10-transformed data. A red color represents relatively higher expression and a green color represents relatively lower expression. (B) Principal component analysis (PCA) plot of the miRNA expression profiles of NDTRs and NDMVs. (C) Summary of selected miRNAs differentially expressed in NDTRs and NDMVs. (D) Validation of selected miRNAs in NDTRs and NDMVs using RT-PCR (n = 10 per each group). (E) The effects of miRNA mimics (miR-1260a, miR-1285-5p, miR-4454, miR-7975, miR-126-3p, miR-150p, and miR-451a) on the expressions of iNOS and arginase in M0-differentiated THP-1 cells (n = 3 per each group). The data are shown as the mean ± SEM. *P < 0.05; **P < 0.01; ***P < 0.001.

