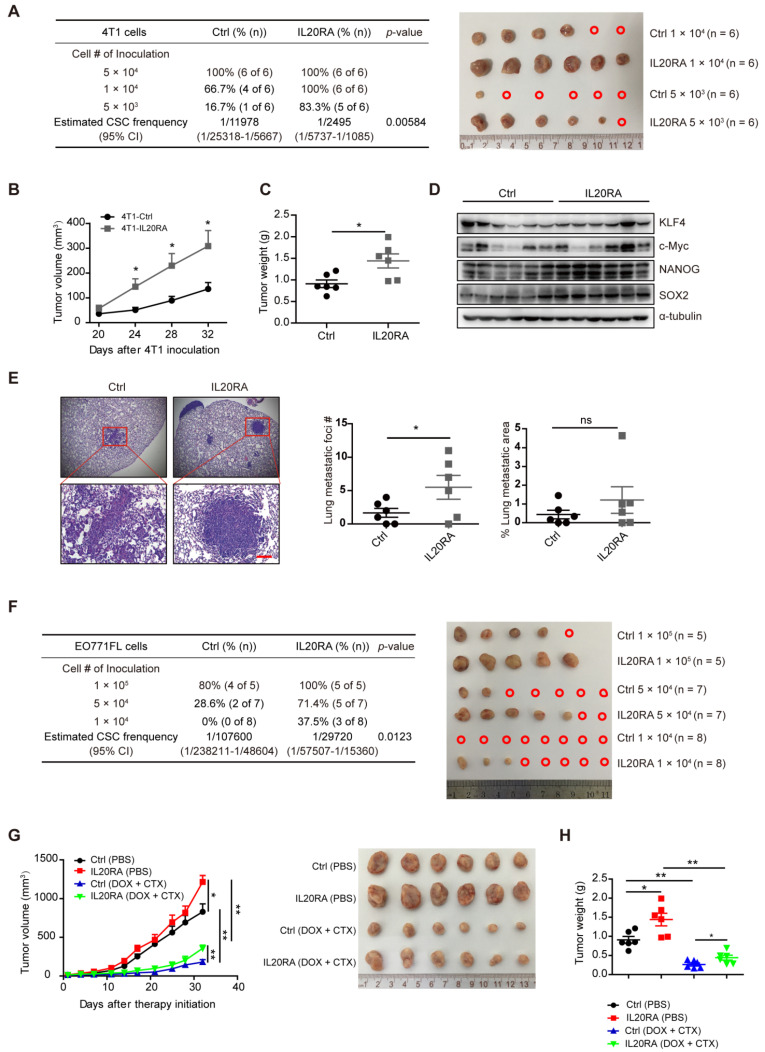
Figure 3.
IL20RA signaling promotes the stemness features of breast cancer in vivo. (A) Left panel: ELDA analysis of the tumor-initiating ability of 4T1 cells, which were injected into the 4th mammary fat pad of BALB/c mice. Right panel: primary tumors derived from different groups. A red open circle indicates no tumor formation. (B-E) The data of tumor growth curve, tumor weight, western blot and lung metastasis come from the 5 × 10⁴ cell-inoculation group: (B) Tumor growth curves of the 4T1-allograft mice (n = 6 mice for each group). (C) Statistical analysis of tumor weights at the end of experiments. Data are presented as mean ± SEM (n = 6 mice for each group). (D) Western blot of KLF4, c-Myc, NANOG and SOX2 in 4T1 allografts. (E) Left panel: representative H&E staining images of lung metastasis in 4T1-allograft mouse models. Scale bar, 100 µm. Right panel: statistical analyses of the metastatic foci number and the percentage of metastatic area of lungs. Data are presented as mean ± SEM, n = 6 mice for each group. (F) Left panel: ELDA analysis of the tumor-initiating ability of EO771FL cells, which were injected into the 4th mammary fat pad of C57BL/6 mice. Right panel: primary tumors derived from different groups. A red open circle indicates no tumor formation. (G) Left panel: tumor growth curves of 4T1-allograft mice receiving DOX plus CTX combined treatment or PBS treatment (n = 6 mice for each group). Tumor volumes between different groups are compared 32 days after the initiation of therapy to determine the statistical significances. Right panel: primary tumors separated from different groups at the end of the experiments. (H) Statistical analysis of tumor weights at the end of experiments. Data are presented as mean ± SEM, n = 6 mice for each group. *, p < 0.05; **, p < 0.01; ns, not significant. Abbreviation: CI, confidence interval.

