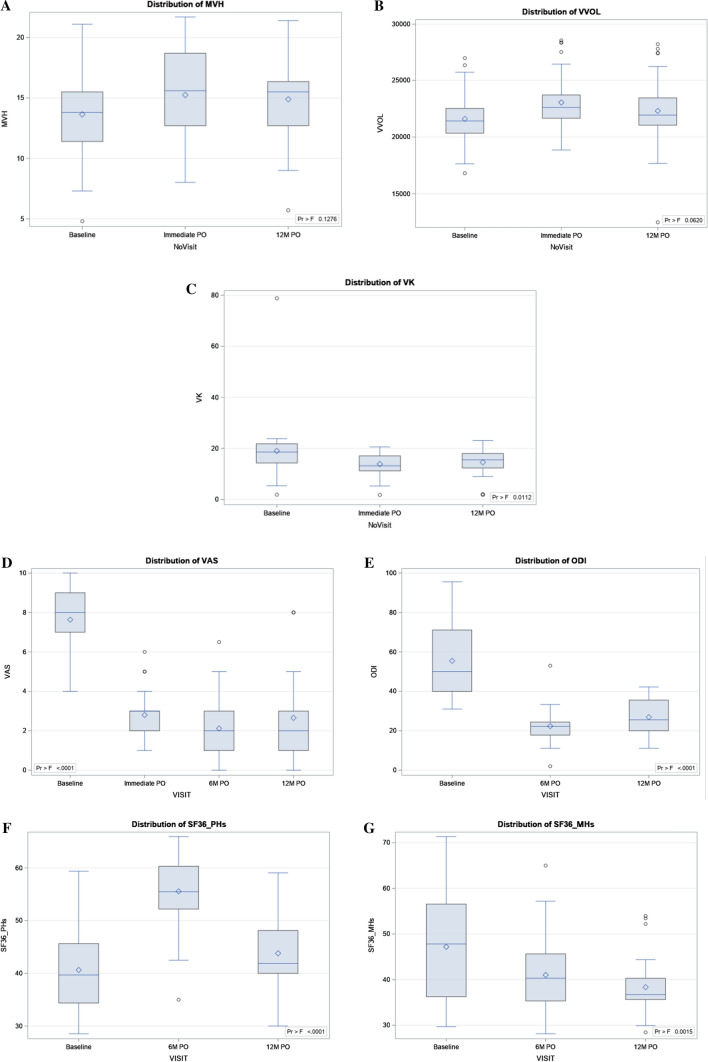
Fig. 3.
Boxplot of middle vertebral height: pre- and postoperative value (a), boxplot of the vertebral body volume: pre- and postoperative values (b), boxplot of the vertebral kyphosis: pre- and postoperative values (c); boxplot of the VAS index: pre- and postoperative values (d); boxplot of the ODI scores: pre- and postoperative values (e); boxplot of the SF36 physical health score: pre- and postoperative values (f); boxplot of the SF36 mental health score: pre- and postoperative values (g). Maximum is the endpoint of upper whisker, third quartile (75th percentile/P75) is the upper edge of box, median (50th percentile) is the line inside box, mean is the symbol marker, first quartile (25th percentile/P25) is the lower edge of box and minimum is the endpoint of lower whisker

