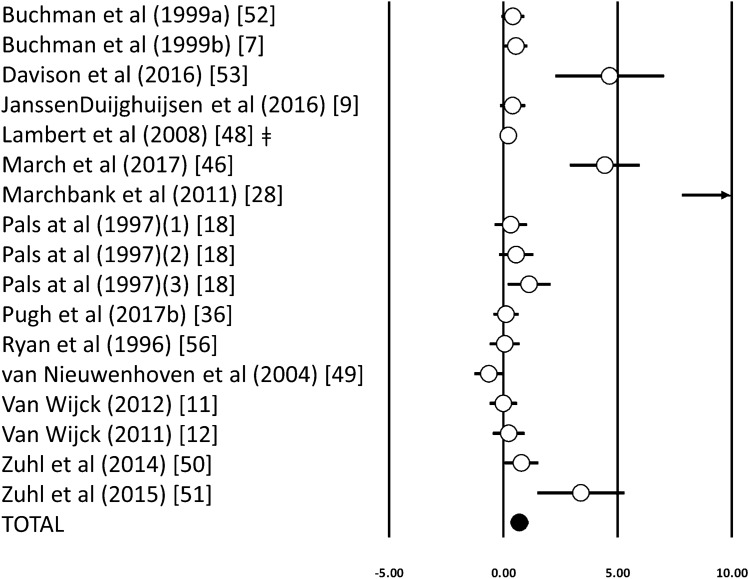
Fig. 3.
Forest plot of standardised mean differences (means ± 95% CIs) for studies evaluating the influence of an acute exercise bout on the ratio of Lactulose and Rhamnose or Lactulose and Mannitol in the urine (disaccharide/monosaccharide). The solid circle represents the ES (mean ± 95% CI) for the model. ǂ, Studies with multiple arms with similar environmental conditions that have been combined to prevent overpowering of the study; a,b, represents different studies from the same author published in the same year; (1, 2) represents studies with multiple arms that were analysed separately; → shows value outside of the figure area and can be found in the raw data in the supplementary material

