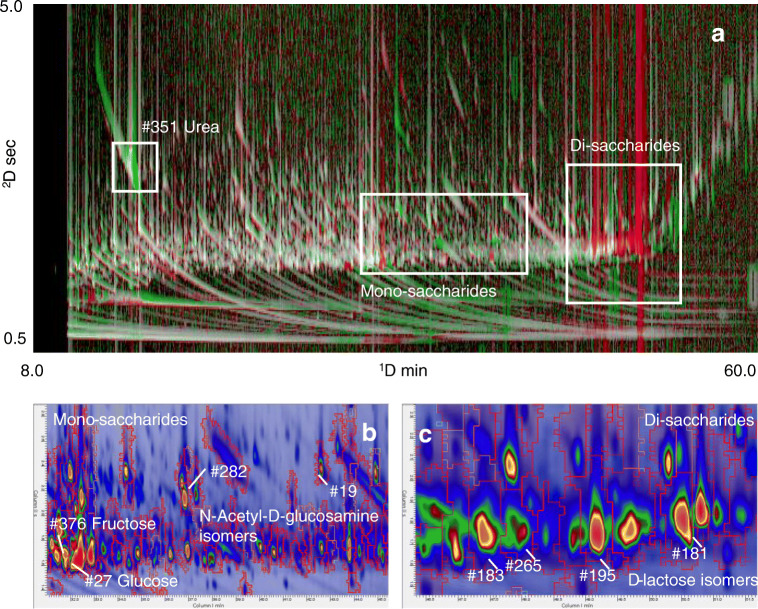
Fig. 6.
Colorized fuzzy ratio rendering (a) of the differential response between composite class images from MUO (analyzed image) and MHO (reference image) samples. Areas in the pattern colored in red correspond to features whose relative TIC response (normalization is done on the total image response) is higher in the reference class image (i.e. MHO), while areas in green represent features with higher responses in the analyzed class image (i.e., MUO). Monosaccharide (b) and disaccharide (c) regions are detailed in enlarged areas

