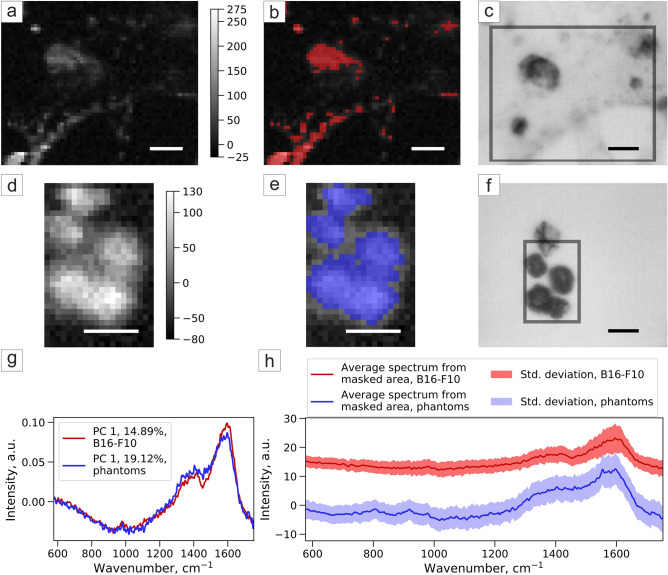
Figure 8.
Principal component analysis of Raman spectroscopy of (a–c) B16F10 and (d–f) melanoma phantoms: (a,d) map of PCA component corresponding to melanin; (b,e) melanin-rich area selected by Otsu thresholding of PCA component map; (c,f) brightfield image, grey frame shows the scanning area; (g) Raman spectra of the component in PCA corresponding to melanin and (h) average Raman spectra with a standard deviation of masked areas of B16F10 and melanoma phantom samples.

