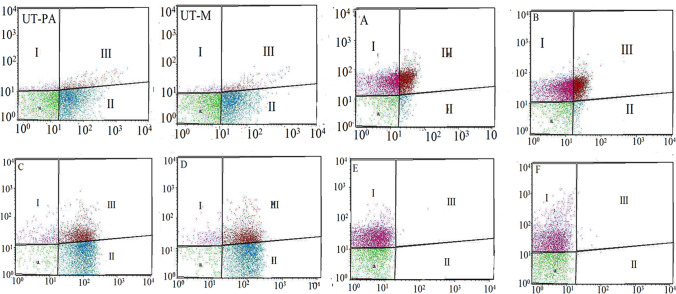
Figure 10.
Membrane integrity assessment by live/dead staining of P. aeruginosa and MRSA cells by flow cytometer. Flow cytometer scatters plot for (UT-PA) untreated P. aeruginosa cells, (UT-M) untreated MRSA cells (A) LP treated P. aeruginosa cells stained with SYTO9/PI stains were analyzed, (B) LP treated MRSA cells stained with SYTO9/PI stain, (C) Cu-NPs treated P. aeruginosa cells stained with SYTO9/PI, (D) Cu-NPs treated MRSA cells stained with SYTO9/PI, (E) EL-LP-CuNPs treated P. aeruginosa cells stained with SYTO9/PI, (F) EL-LP-CuNPs treated MRSA cells.

