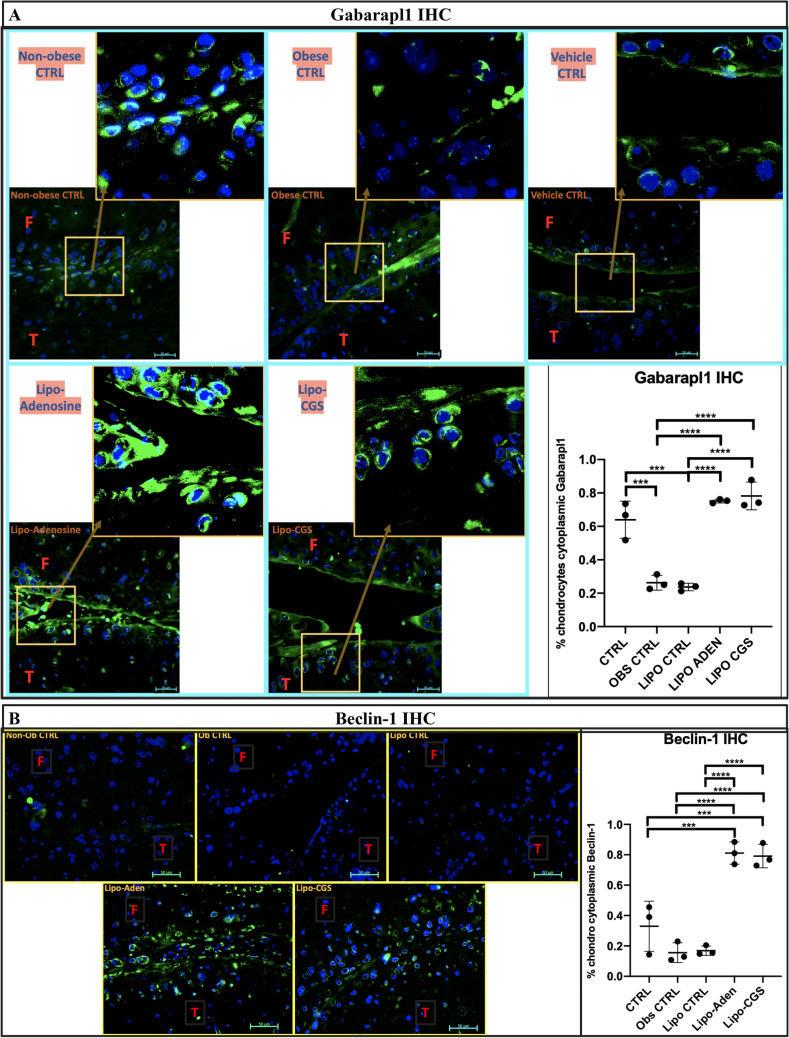
Figure 6.
Autophagic flux is increased in vivo with A2AR stimulation as demonstrated for the proteins identified in vitro including Gabarapl1 and Beclin-1. (A) 40 × magnified joint sections (with further magnified view in box provided) stained for Gabarapl1 (green fluorescence) using IF/IHC in the obesity mouse model of arthritis. These are representative 40 × hpf images from n = 3 mice. At the bottom right, there is a 1-way ANOVA was performed assessing individual cell thresholded fluorescence to calculate the percent of IHC 40 × HPF in 3 mice per group by counting medial compartment intra-articular chondrocyte cell fluorescence. Mean percent and standard deviation for the 5 in vivo groups are recorded in order by non-obese CTRL, obese CTRL, liposome only joint injection, adenosine injection, and A2AR agonist injection (64% ± 11%, 26% ± 4.5%, 24% ± 2.3%, 75% ± 1.1%, 78% ± 8.3%; * p < 0.05, ** p < 0.01, *** p < 0.001, **** p < 0.0001, n = 3 per group, 1-way ANOVA followed by individual comparisons using Tukey multiple comparison tests). (B) 40 × magnified joint sections stained for Beclin-1 (green fluorescence) using IF/IHC in the obesity mouse model of arthritis. These are representative 40 × hpf images from n = 3 mice. Graphical analysis of the Beclin-1 IHC analysis by 1-way ANOVA using ImageJ analysis to equally threshold percentage of cells with cytoplasmic fluorescence is provided in the bottom right corner (*p < 0.05, ** p < 0.01, *** p < 0.001, **** p < 0.0001). Figure labels: F is femur, T is tibia, M is meniscus.

