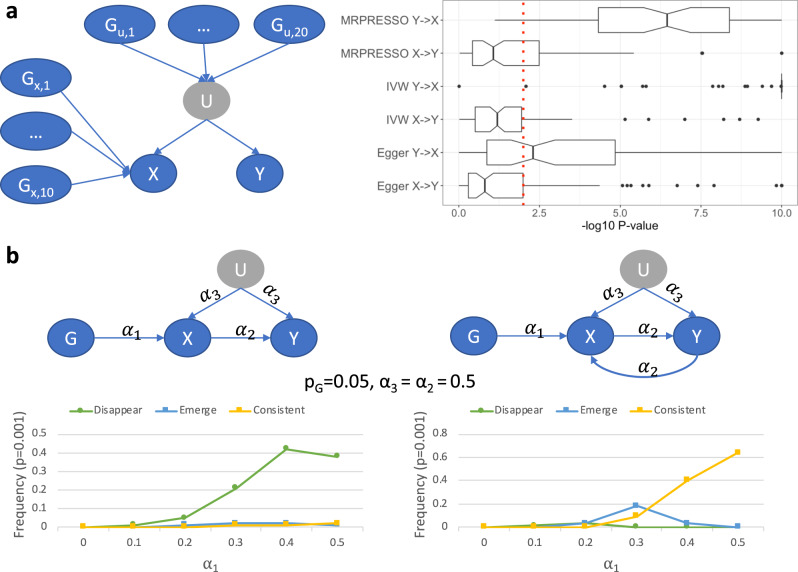
Fig. 2. Simulations of simple graphs illustrate some limitations of MR and the faithfulness assumption.
a When simulating from linear models from the presented graph (n = 2000 samples), MR methods tend to erroneously predict causal links between X and Y. The left panel shows the graph, where the gray node U is an unobserved common cause (confounder) of X and Y. The right panel shows the distribution of the (−log10) p-values of different MR methods when analyzing X and Y. Each boxplot shows the median, and first and third quartiles. The whiskers extend from the hinge to the largest and lowest values, but no further than 1.5 * (the inter-quantile range). As input for MR, summary statistics were computed using linear regression and instruments were selected using a p < 10−04 cutoff. b Simulations from simple MR models with a single binary instrument show violations of faithfulness in finite samples. Each line presents the frequency of different dependency patterns between the simulated genetic instrument G and the phenotypes Y and X. In all simulated cases G and X were significantly associated at p < 0.001, and are thus not shown. Disappearing associations: G and Y are associated marginally, but become independent when conditioned on X (p > 0.1). Emerging associations: G and Y are independent but become associated when conditioned on X. Consistent: G and Y are significantly associated with and without conditioning on X. Even though under faithfulness G and Y should be associated with and without conditioning on X (in both graphs, X acts as a collider on the path from G to Y through U), we see mixed results. Nevertheless, the detected associations occur only when a non-blocked path exists between G and Y, satisfying our refined local faithfulness assumption.

