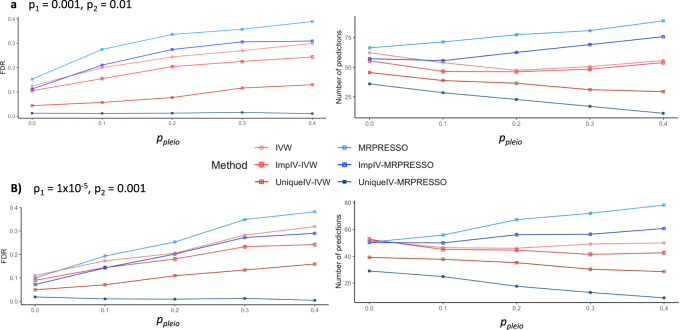
Fig. 3. Mean number of discoveries and empirical false discovery rates (FDR) of Mendelian randomization methods in simulated data from graphs with 15 continuous traits.
The underlying causal diagram was generated such that the expected in- and out-going degrees of the traits were 1.5. All simulated graphs contained cycles. For each trait we added between 10 and 20 binary instruments (uniformly, i.i.d). To add horizontal pleiotropy, for each instrument we decided whether it is horizontally pleiotropic or not with probability ppleio, and if so, we added between 1 and 10 links into additional traits (uniformly, iid). When generating datasets, the traits had standard normal noise, causal quantities were randomly and uniformly sampled such that their absolute value was between 0.1 and 0.9, and binary instruments were generated randomly with a probability between 0.05 and 0.4. The plots show the mean results of the simulations for different ppleio values (e.g., the mean of the empirical FDR over the simulated graphs). Discoveries from each statistical test were done at a 10% significance level after adjusting for FDR using the BY algorithm. When two methods have a similar empirical FDR, greater number of predictions correspond to greater power. a Results with p1 = 0.001 and p2 = 0.01. b Results with p1 = 1 × 10−05 and p2 = 0.001. MR-Egger is not presented as it consistently had greater empirical FDR values than the other methods.

