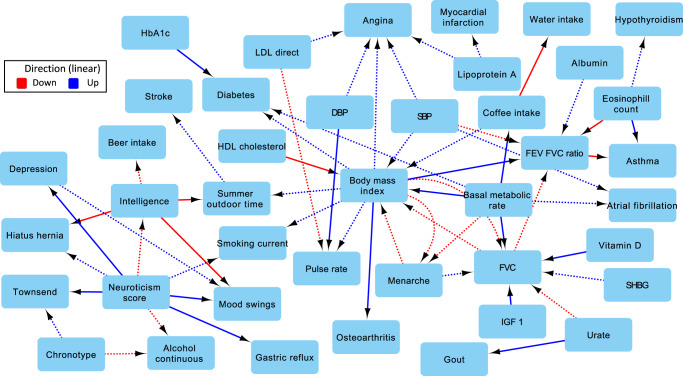
Fig. 5. cGAUGE MR analysis with p1 = 1 × 10−07 and p2 = 0.001.
All presented links were detected at 10% BY FDR correction and had π1 > 0.25. Solid arrows represent GT edges (phenotypes whose correlation is robust to conditioning) and dashed arrows represent GT non-edges. For simplicity, we excluded waist circumference and height, arrows out of diseases, and arrows into biomarkers. DBP diastolic blood pressure, SBP systolic blood pressure, HbA1c hemoglobin A1c levels, FEV forced expiratory volume, FVC forced vital capacity, IGF1 insulin like growth factor 1 levels, LDL direct low-density lipoprotein levels, HDL cholesterol high-density lipoprotein levels, SHBG sex hormone-binding globulin levels.

