Figure 8.
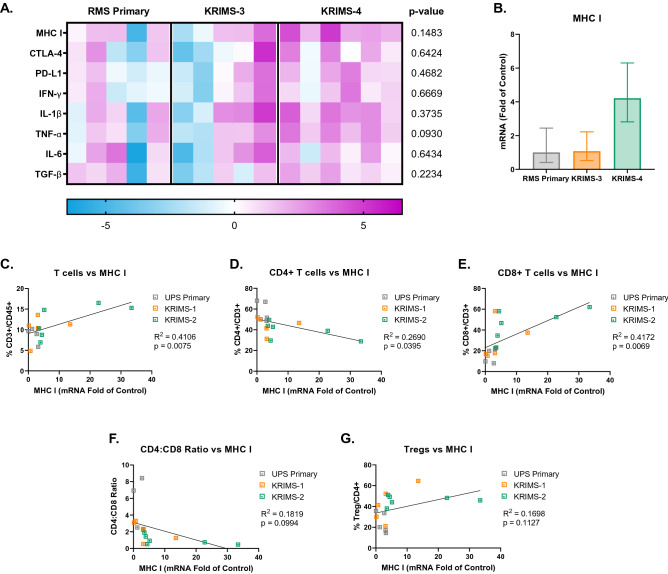
Expression of immunomodulatory genes in RMS tumor models. (A) Heat map of quantitative RT-PCR data analyzing gene expression of tumors matching those used for immunoprofiling in Figs. 5 and 6. Each column represents an individual tumor. Values are relative to the average expression of RMS primary tumors, with increased expression shown in pink and decreased expression shown in blue. Data analyzed by one-way ANOVA with a p-value < 0.05 denoted by a star. n = 5–6 tumors per group. (B) MHCI expression is elevated in KRIMS-4 tumors compared compared to RMS primary and KRIMS-3 tumors, though this is not statistically significant (p = 0.1483). Average mRNA fold change (2-ΔΔCT) ± SEM. (C–G) Correlation of MHCI expression and T cell populations using simple linear regression to analyze matching samples. There is strong positive correlation between MHCI has a strong positive correlation with CD3 + and CD8 + T cells (C, E), and a negative correlation with CD4 + T cells (D) and CD4:CD8 ratio (F). R2 indicates goodness of fit. A p-value < 0.05 indicates a slope significantly different than zero. n = 16 mice per correlation analysis.

