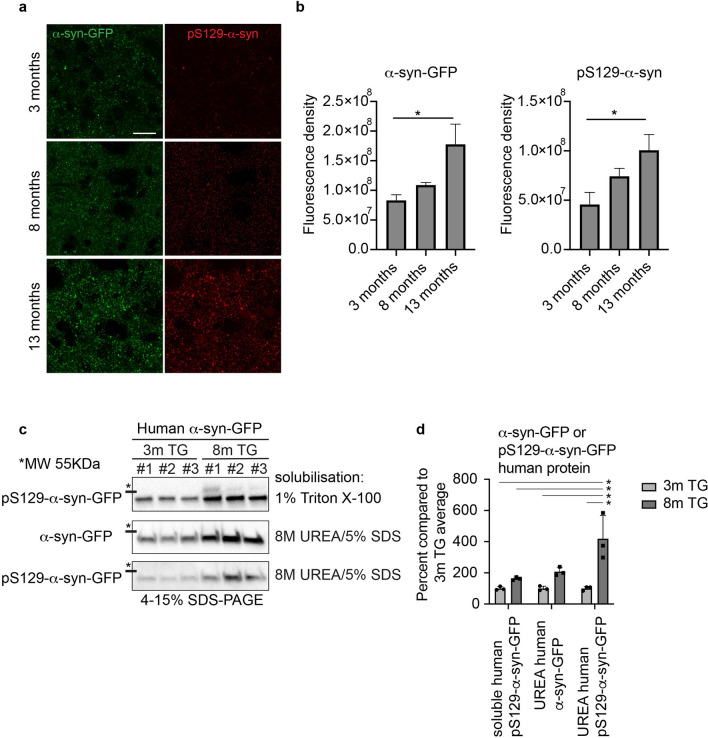
Figure 1.
Progressive accumulation and aggregation of α-syn and p-α-syn in the striatum of the TG mice. (a) Reconstructed confocal image showing the fluorescence density level of α-syn-GFP and pS129-α-syn in the dorsolateral striatum of TG mice at age 3, 8, and 13 months (Z thickness 4 μm, step size 0.3 μm). Scale bar: 20 μm. (b) Corresponding quantification of the α-syn-GFP and pS129-α-syn fluorescence density in the dorsolateral striatum of TG mice at age of 3 months (n = 3), 8 months (n = 3) and 13 months (n = 3). One-way ANOVA: *p-value < 0.05. (c) Fractionation of 1% Triton-X-100 soluble, and insoluble α-syn solubilized in 8 M urea, 5% SDS. Human α-syn-GFP and human pS129-α-syn-GFP protein was quantified in Image J from western blots based on the mobility compared to the mouse α-syn. Images from the western blots of the Triton X-100 soluble human α-syn compared to human α-syn and pS129-α-syn in the Triton X-100 insoluble fraction. The full-length blots are presented in Supplementary Fig. 1c. Data in (c) were quantified in (d), two way-ANOVA, Tukey multiple correction analysis: *p-value < 0.05. Human α-syn was quantified by western blot in the Triton X-100 soluble, and wash 4 fractions (Supplementary Fig. 1b). α-syn-GFP = alpha-synuclein green fluorescent protein, pS129-α-syn = phospho S129-alpha-synuclein.

