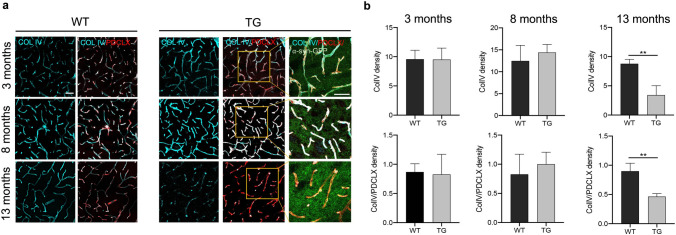
Figure 6.
Reduction of Col IV in TG mice at late age. (a) Confocal images illustrating Col IV density and its proportion in relation to the PDCLX+ vessels in WT (left panel) and TG mice (right panel). (b) Quantification of Col IV density and its proportion in relation to the PDCLX+ vessels in WT and TG mice at age of 3 months (n = 3 WT, 3 TG); age of 8 months (n = 3 WT, 3 TG); and age of 13 months (n = 3 WT, 3TG). Two-tailed student’s t-test: *p-value < 0.05. Scale bar: 50 μm. PDCLX = Podocalyxin, Col IV = Collagen IV.

