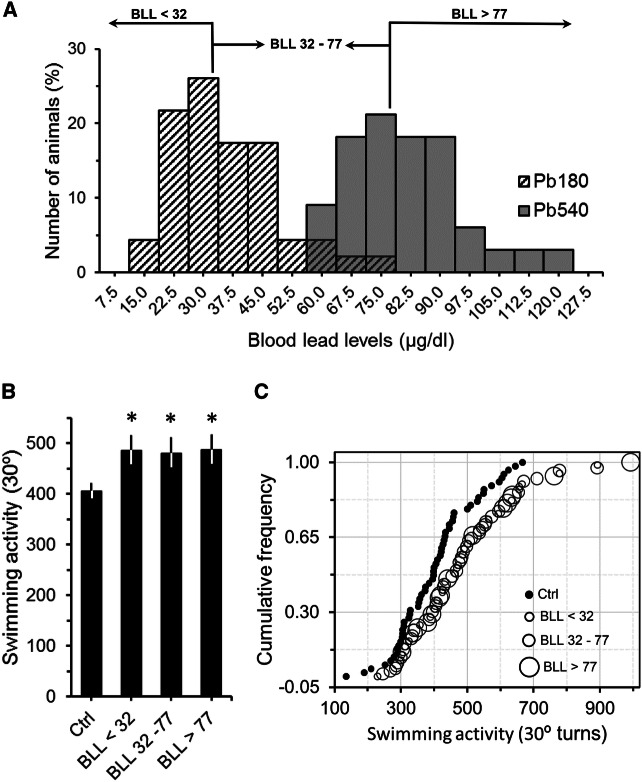
Fig. 3.
Sample stratification based on blood lead levels (BLL). a Histogram plotting BLL of animals that received 180 ppm (Pb180) or 540 ppm (Pb540) of lead acetate in their ad-lib water supply (same sample depicted in Fig. 2b). Note that BLL frequencies for both lead doses were consistent with a normal distribution. Cut points for low (< 32 µg/dL), middle (between 32 and 77 µg/dL) and high (> 77 µg/dL) BLL were based on the mean of each distribution (Pb180, mean = 35.1; Pb540, mean = 75.4). Vertical lines and horizontal arrows delineate data cut points and ranges, respectively. b Graph showing the averaged swimming activity in the FST as a function of sample stratification depicted in (a). Note that, regardless of BLL (low, middle or high), all lead exposed groups had an averaged swimming activity significantly higher than that observed for controls (Ctrl). Bars are means ± SEM. *p < 0.05 compared to Ctrl. c Cumulative frequency of animals plotted as a function of their total swimming activity for control (filled circles, Ctrl) and lead exposed animals (open circles). For lead exposed animals, symbol's size reflects BLL (low, middle or high). Note that the BLL distribution is skewed to the right relative to the Ctrl one and that BLL symbol sizes are scattered in no orderly manner (i.e. low to high levels or high to low), emphasizing an increase in swimming activity irrespective of BLL magnitude. Ctrl, n = 57 animals from 15 litters; Pb180, n = 46 animals from 9 litters; Pb540, n = 34 from 6 litters

