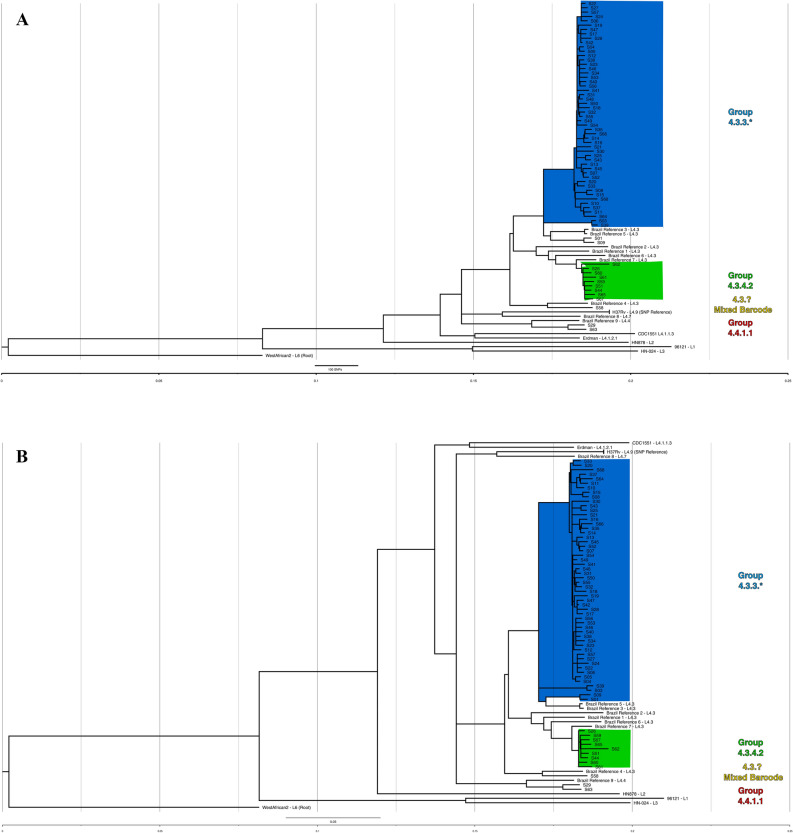
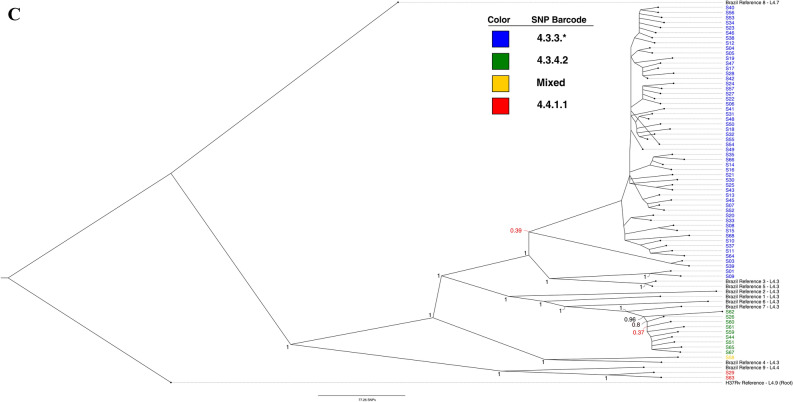
Figure 1.
(A) Maximum likelihood (ML) tree showing SNP-based phylogenetic analysis of core SNPs extracted by snippy. Analysis by MEGA-X (default parameters, HKY model) with 500 bootstrap replicates. Tree with highest log likelihood is shown (− 53,357.07). Tree was visualized in FigTree, and labeling generated in Inkscape software. The tree is rooted to M. tuberculosis GM041182 (West African 2). The tree is drawn to scale, with branch lengths measured in average substitutions per site (7420 sites total). Bootstrap values are robust across the entire tree and are available in Supplemental 4. Pairwise distances are available in Supplemental 3. Coloring represents groups identified by Coll et al.’s TB barcoding strategy, that groups the isolates based on the presence or absence of lineage-determining SNPs (Supplemental 2). The tree cleanly groups similarly barcoded TB isolates and suggests divergence of sampled isolates even from recent local reference isolates. (B) Bayesian consensus phylogram showing SNP-based phylogenetic analysis of 7420 core SNPs extracted by snippy. Analysis performed by MrBayes (GTR model, nst = mixed, mcmc = 500,000). Tree was visualized in FigTree, and labeling generated in Inkscape software. The tree is rooted to M. tuberculosis GM041182 (West African 2). All tree statistics and raw files are available in Supplemental 5. Coloring represents groups identified by Coll et al.’s TB barcoding strategy available in Supplemental B. The tree demonstrates nearly identical grouping of all isolates as the maximum likelihood tree in (A) and lends even more support for barcoding-based grouping. (C) Maximum likelihood (ML) tree showing SNP-based phylogenetic analysis of core SNPs extracted by snippy without global reference lineages. Analysis by MEGA-X (default parameters, HKY model) with 1000 bootstrap replicates. Tree with highest log likelihood is shown (− 30,203.04). Tree was visualized in FigTree, and labeling generated in Inkscape software. The tree is rooted to M. tuberculosis H37Rv (Lineage 4.9). The tree is drawn to scale, with branch lengths measured in average substitutions per site (3863 sites total). Bootstrap values are labeled at branch points if greater than 70%, and any points where support falls under 70% is labeled in red and further values are not provided for the clade. Coloring represents groups identified by Coll et al.’s TB barcoding strategy available in Supplemental 2. Without global reference lineages, barcoded isolates still group reliably. S09/S01 and S03/S39 (blue clade, bottom four isolates) stand out by branch lengths as divergent from rest of blue clade.


