Figure 3.
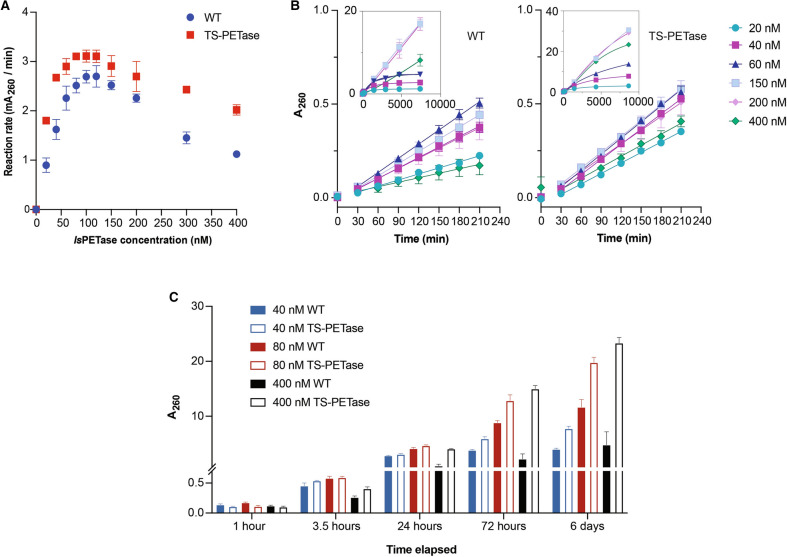
Wild-type vs. TS-PETase enzyme kinetics at 30ºC. (A) Plot of initial rates in terms of mA260 per minute vs. enzyme concentration for wild-type and TS-PETase (n ≥ 4 per concentration). All measurements were performed on a NanoDrop 1000 and values reported with a path length of 1 cm. (B) Initial rates determined using bulk absorbance at representative enzyme concentrations (n ≥ 4 per concentration); insets display representative product accumulation profiles over extended time (n = 3). (C) Comparison of product evolution profile by bulk absorbance of wild-type versus TS-PETase over six days (n ≥ 3 per time point). Wild-type bars are solid, TS-PETase bars are bordered. Error bars for all panels represent SEM from two or more independent experiments performed on different days.

