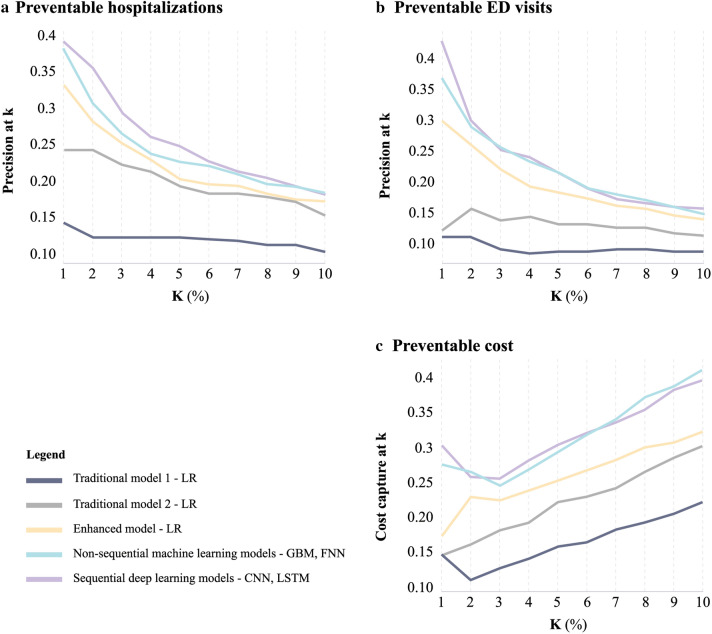
Figure 2.
Predictive Models to Assess the Precision at k and Cost Capture at k for the Prediction of Preventable Hospitalizations, Preventable Emergency Department Visits, and Preventable Costs among Heart Failure Patients. (a, b) precision (PPV) at k for different thresholds (k). Precision at k considers only the topmost patients (top k%) ranked by the model, and therefore presents the accuracy of the model's ranking at a certain threshold. E.g. precision at 10% corresponds to PPV among the patients ranked by each model at the top decile. (c) cost capture at k for different thresholds (k), E.g. cost capture at 10 corresponds to the ratio between the predicted preventable costs to the actual preventable costs among the patients ranked by each model at the top decile. The figure was edited using Adobe Illustrator Creative Cloud version 24.2.121. CNN, Convolutional Neural Network; FNN, Feedforward Neural Network; GBM, Gradient Boosting Model; LSTM, Long Short-Term Memory; LR, Logistic Regression; PPV, Positive Predictive Value.

