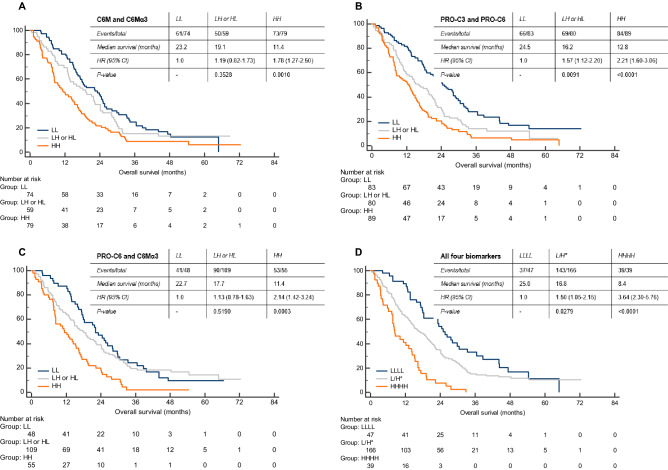
Figure 5.
Assessment of the prognostic potential of combining the different biomarkers by Kaplan Meier plots. (A) LL; low C6M and low C6Mα3, LH or HL; low C6M and high C6Mα3 or high C6M and low C6Mα3, HH; high C6M and high C6Mα3. (B) LL; low PRO-C3 and low PRO-C6, LH or HL; low PRO-C3 and high PRO-C6 or high PRO-C3 and low PRO-C6, HH; high PRO-C6 and high PRO-C6. (C) LL; low PRO-C6 and low C6Mα3, LH or HL; low PRO-C6 and high C6Mα3 or high PRO-C6 and low C6Mα3, HH; high PRO-C6 and high C6Mα3. (D) LLLL; low PRO-3, PRO-C6, C6M and C6Mα3, L/H*; at least one low or high PRO-C3, PRO-C6, C6M or C6Mα3, HHHH; high PRO-C3, PRO-C6, C6M and C6Mα3. Univariate Cox proportional-hazards regression was used to calculate the hazard ratios (HR) with 95% Cl and p-values. A p < 0.05 was considered significant.

