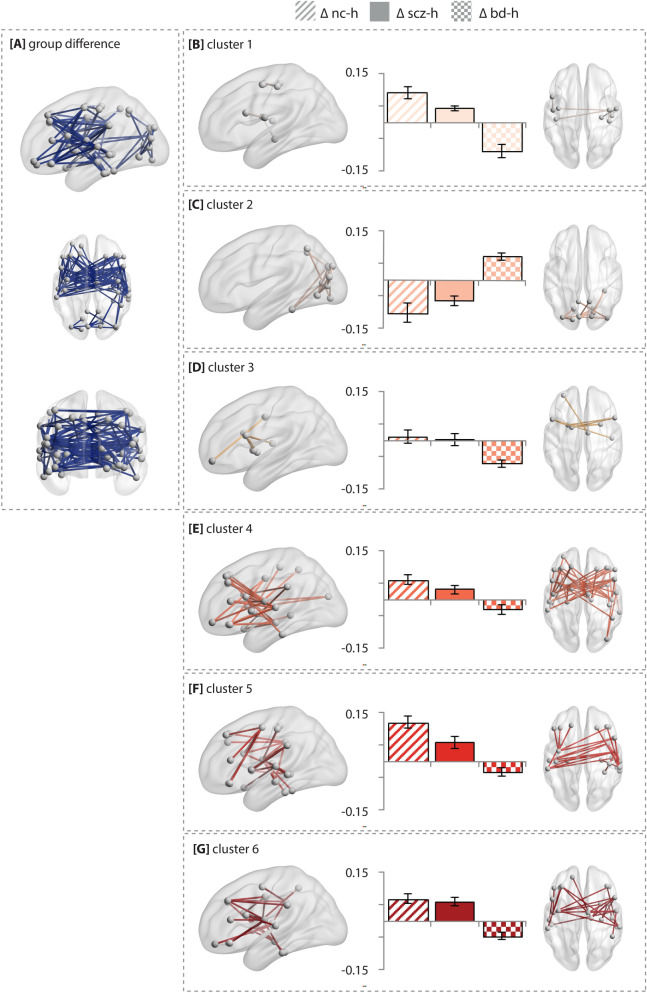
Figure 3.
Sets of connections clustered according to their behavior in clinical and non-clinical individuals with hallucinations. (A) The result of the overall group comparison between patients with schizophrenia (n = 99), patients with bipolar-I disorder with (n = 74) and non-clinical individuals with hallucinations (n = 40) using the AAL atlas. (B–E) the edges in the component that differed between the groups were clustered by a k-means clustering algorithm to elucidate differences across the groups with hallucinations. Error bars represent the standard deviation of connectivity strength within that particular cluster. The group differences were tested using an F-test at T = 8.0; P < 0.05 at 10,000 permutations. The test-statistics and AAL labels corresponding to the altered connections per cluster can be found in Supplementary Table 9. Age and sex were included as covariates. NC-H non-clinical individuals with hallucinations, BD-H bipolar-I disorder with lifetime history of hallucinations, SCZ-H schizophrenia spectrum disorder with hallucinations.

