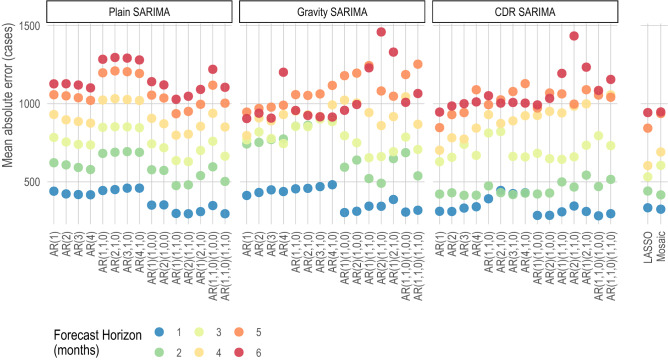
Figure 1.
Mean absolute error (MAE) for all Bangkok models. The mean absolute error (y-axis) expressed as number of cases for each model (x-axis) and for each forecast. Models are grouped as SARIMA with no exogenous variables (Plain), SARIMAs with the top 5 most connected regions based on the predicted trips from a gravity model (Gravity SARIMA), and SARIMAs with the top 5 most connected regions based on CDR data (CDR SARIMA). The rightmost models show a data-driven network model, denoted as LASSO, since it is based on a least absolute shrinkage and selection operator prediction model, and mosaic model.

