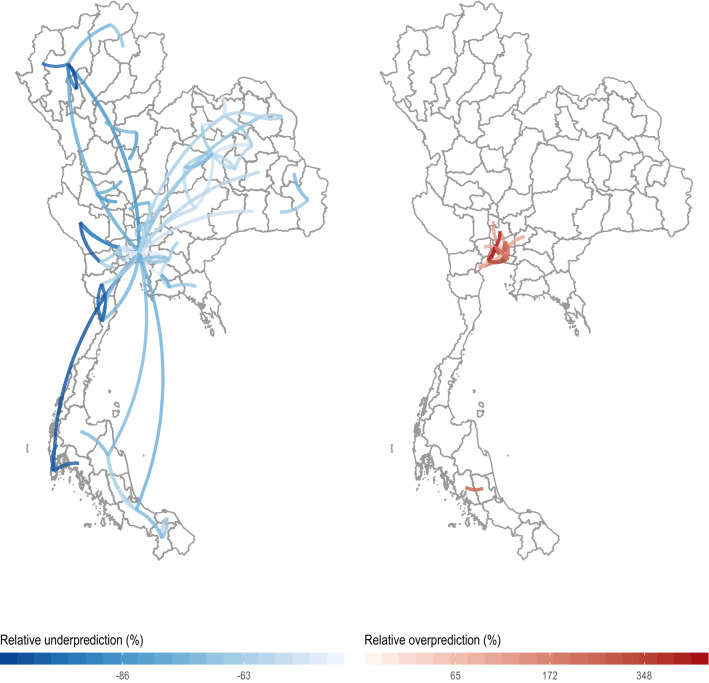
Figure 5.
Under- and over-prediction of outlier travel. Relative under-prediction (left) and over-prediction (right) comparing observed mobility data (from CDRs) to estimated mobility data from the best fit gravity model. We defined relative prediction error as 100%*(PredictedTrips − ObservedTrips)/ObservedTrips. We highlight only observations with Cook’s distance greater than five times the average Cook’s distance. Note that Bangkok (center of the map) is central to much of the over- and under-prediction outliers with most over-prediction near Bangkok. All plots were made using ggplot255 in R 4.0.156.

