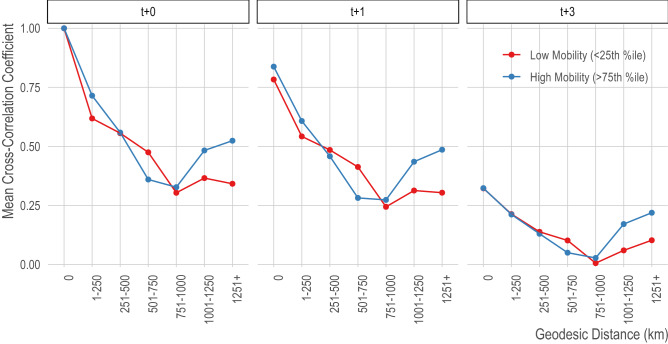
Figure 7.
Correlation of province-level dengue by distance, at different time lags. We show the mean cross-correlation coefficient (y-axis) for pairs of provinces at binned distances (x-axis; 0 indicates correlation of an area with itself) for synchronous dengue (left panel) and lagged by 1 month (middle panel) and 3 months (right panel). The lines are separated based on the connectivity of pairs of provinces where the red line shows the bottom quartile of provinces in terms of incoming and outgoing travel and the blue line shows the top quartile. Bangkok, an important travel hub, is in the approximate center of Thailand and between 700 and 800 km from all other provinces, therefore the last two distance categories do not include Bangkok.

