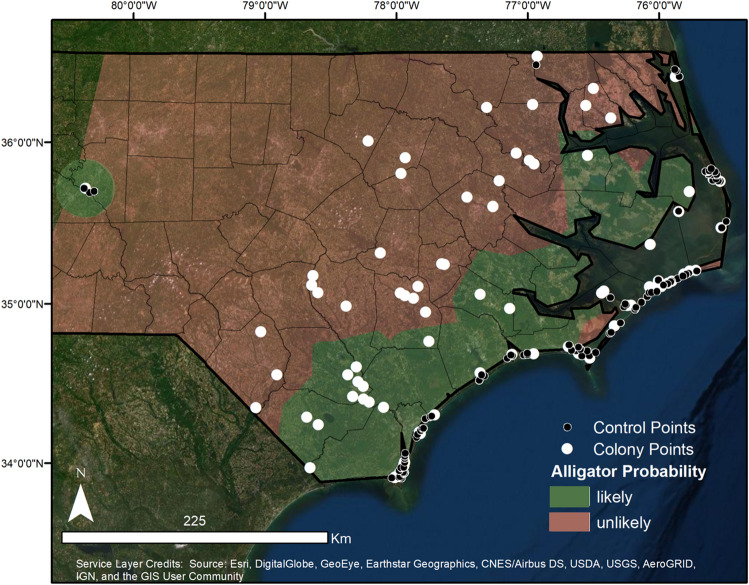
Figure 1.
Map of the study area with locations for all wading bird colonies and control islands included in the analysis and the general alligator probability assignments throughout North Carolina. Solid white circles represent colony locations (island and mainland colonies) and small black circles represent available colony islands. Green blocks are areas where alligator occurrence is likely and red blocks are areas where alligator occurrence is unlikely. Note that available colony islands were only created for island colonies. Map generated in ESRI ArcMap 10.683 (http://www.esri.com/). Main map satellite imagery is the World Imagery basemap within ArcGIS 10.6 software (http://www.esri.com/data/basemaps), see Service Layer Credits.

