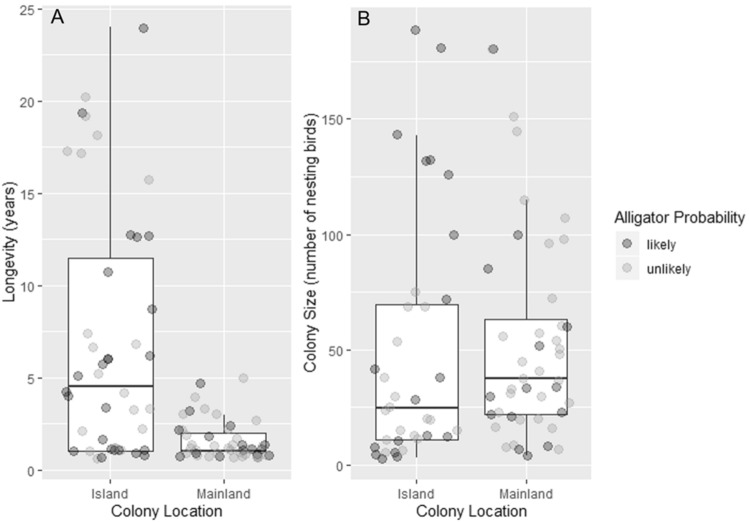
Figure 3.
Mainland and island colony characteristics of (A) longevity (number of years) and (B) colony size (total number of nesting birds) relative to alligator probability. Likely alligator probability is represented by dark circles, unlikely alligator probability is represented by light circles. For boxes, central line shows the median and boxes include all values within the 0.25 and 0.75 quantiles. Whiskers indicate range excluding outliers.

