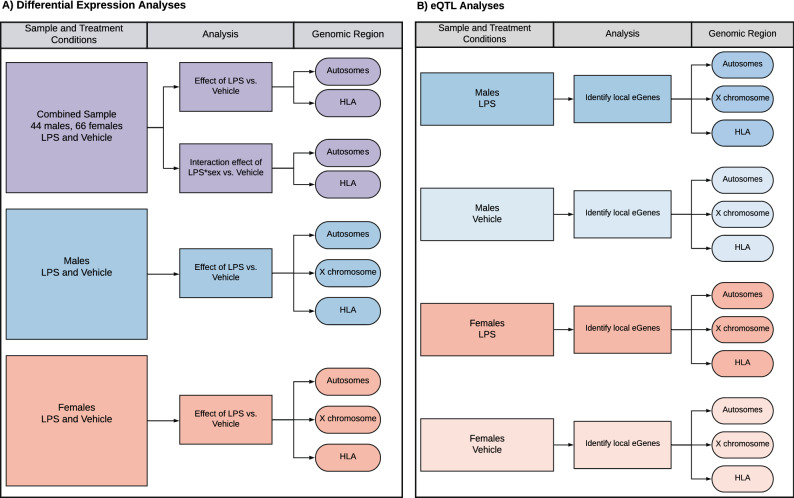
Figure 1.
Study overview. Where shown, HLA and X-linked genes were analyzed together with the remaining autosomal genes but are discussed separately in the manuscript and are therefore shown here separate from the autosomes to follow the manuscript flow. (A) Flowchart of differential expression analysis. Analyses of autosomal genes in the combined sample (main effect and sex interaction) is shown in lavender, analyses of X-linked genes in males and females separately (autosomal genes included for comparison) are shown in blue and orange, respectively. (B) Flowchart of eQTL mapping in each of the four groups.

