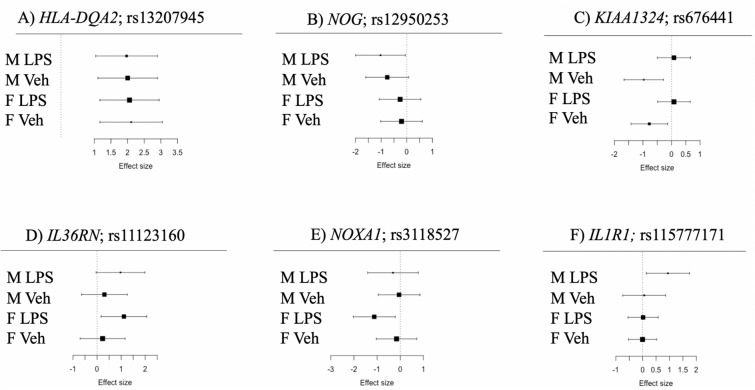
Figure 6.
Meta-analysis forest plots showing the effect size (x-axis) of exemplar gene-SNP pairs for each treatment condition (y-axis; M LPS: expression data in males in the LPS-treated samples; M Veh: expression data in males in the untreated controls; F LPS: expression data in females in the LPS-treated samples; F Veh: expression data in females in the untreated controls). Black boxes show the mean effect size; and the size of the box is proportional to the inverse of the standard error (larger boxes indicate a smaller standard error). The gray lines show the 95% confidence intervals. All eQTLs shown are significant in at least one condition at an lfsr < 0.05. (A) Example of an eQTL shared across all conditions. HLA-DQA2, Human leukocyte antigen DQ alpha 2. (B) Example of a sex-specific eQTL (males), NOG, Noggin. (C) Example of a treatment-specific eQTL (vehicle only), KIAA1324, estrogen-induced gene 121 protein. (D) Example of a treatment-specific eQTL (LPS only). IL36RN, interleukin 36 receptor antagonist. (E) Example of a treatment specific and sex specific eQTL (Female LPS only), NOXA1, NADPH oxidase activator 1. (F) Example of a treatment specific and sex specific eQTL (Male LPS only), IL1R1, interleukin 1 receptor type 1.

