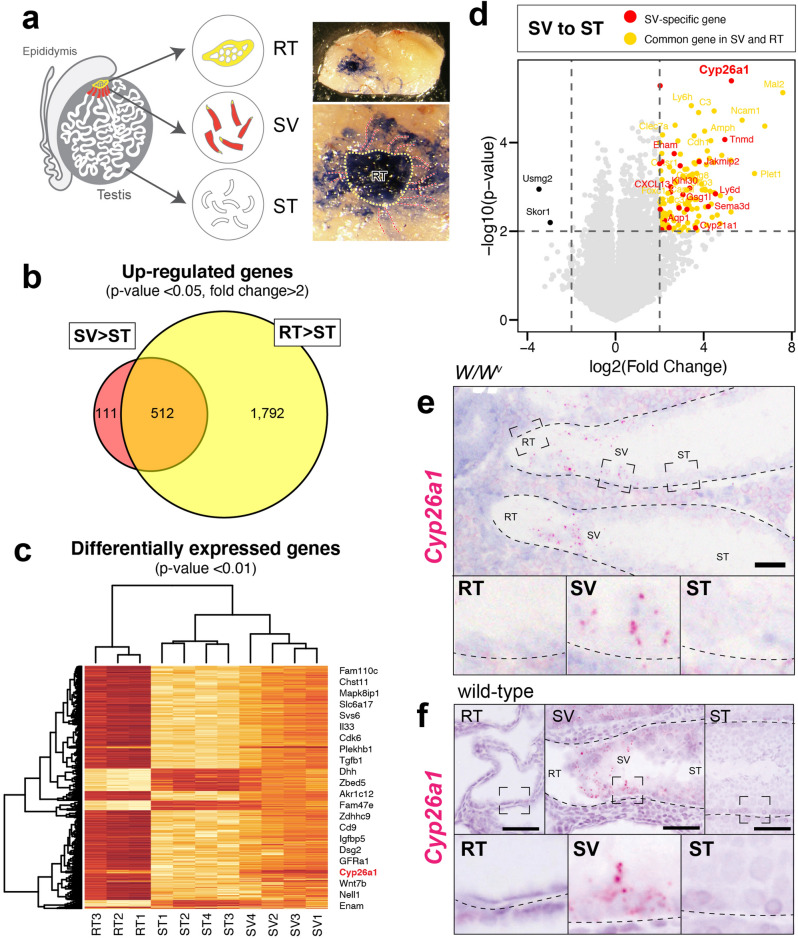
Figure 4.
Identification of Cyp26a1 as an SV-specifically upregulated gene. (a) Schematics illustration and dissecting micrographs of the RT (yellow broken line) and the SV (red broken lines) of a W/Wv mutant mouse testis injected with trypan blue solution through the efferent ducts. 20 testes were used for each set of microarrays, and we subjected 3 sets of RT and 4 sets of SV and ST for the microarray analysis. (b) Venn diagrams of the probes highly expressed in the SV (623 genes) and the RT (2,304genes) compared to the ST (> twofold changes with p-value < 0.05). 111 probes were exclusively expressed in the SV region, which can be regarded as the SV-specific probes. (c) Heatmap representation of 862 DEGs with p-value < 0.01. (d) Volcano plot of log2 Fold Change (x-axis) and -log10 p-value (y-axis) of the SV in comparison with the ST. Red dots represent the genes exclusively expressed in the SV, while orange dots represent the genes which also express in the RT. (e,f) In situ hybridization images show high Cyp26a1 signals in the SV epithelia in the W/Wv (e) and wild-type (f) mouse testes. In (e–f), lower panels show magnification of the area indicated by broken rectangles in the upper panels. Figures in c and d were generated by using R60. Broken lines in (e–f) indicate the outlines of the ST. RT rete testis, SV Sertoli valve, ST seminiferous tubule. Scale bars represent 50 µm.

