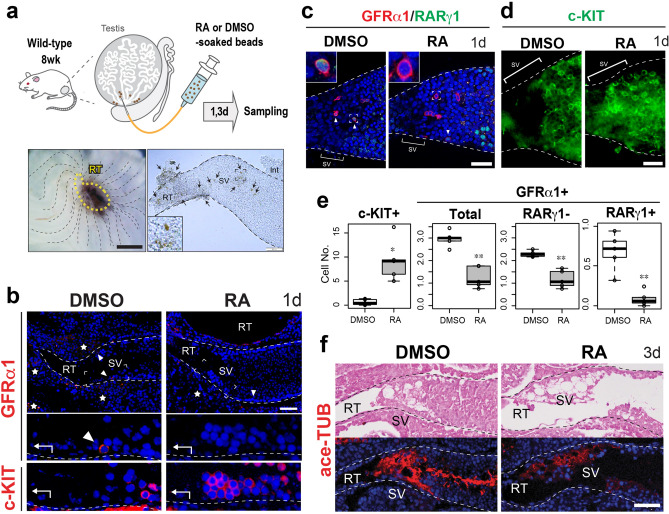
Figure 5.
RA-induced ectopic appearance of Adiff patches in the SV, leading to structural alterations of the SV epithelia of wild-type mouse testes. (a) Schematic representation of RA or DMSO (control)-soaked beads treatment. Left bottom panel shows the gross morphology of the testis removed of tunica albuginea, transplanted with the beads (brown) locally around the SV region, beneath the RT region indicated by the yellow broken line. Right bottom panel shows the image of an isolated SV fragment, around which the beads are attached (brown, arrows). The phenotypes of the SV epithelia were examined at day 1 (b–e) and day 3 (f) after RA treatment (n = 4 each). (b) Anti-GFRα1 (red, arrowheads) and anti-c-KIT (red) staining of the serial sections of the SV region, showing an ectopic appearance of a c-KIT-positive Adiff within the SV epithelia of RA-treated testes. (c–e) Whole mount immunohistochemistry of anti-GFRα1 (cell surface staining, red)/RARγ1 (nuclear staining, green) (c) and anti-c-KIT (green; d) in the SV region, showing the disappearance of GFRα1/RARγ1-double positive cells (arrowheads) and the ectopic appearance of c-KIT-positive Adiff patches in the proximal SV region (upper left insets in c, higher magnified images of the GFRα1-positive cell indicated by the broken square). In (e), box plots show significant alterations of c-KIT and GFRα1-positive (total, RARγ1-positive and -negative) cell number within the proximal SV region (0 ~ 50 μm from RT; n = 5; *p < 0.05; **p < 0.01). Analysis was performed using unpaired Student’s t-test. (f) HE staining and ace-TUB (red) immunohistochemistry of the SV region at day 3 after RA treatment showing the disrupted ace-TUB signals in the SV region. Broken lines indicate the outlines of the ST. Images in c were taken by confocal microscopy. Insets in (a) and (c) and lower panels in (b) indicate the magnification of the region surrounded by broken rectangles in each panel. Figures in (e) were generated by using R60. Stars in (b), non-specific signals in the interstitium. Int interstitial tissue, RT rete testis, SV Sertoli valve, ST seminiferous tubule. Scale bars represent 500 µm in the left panel of a, and 50 µm in the right panel of (b–d) and (f).

