
Figure 7.
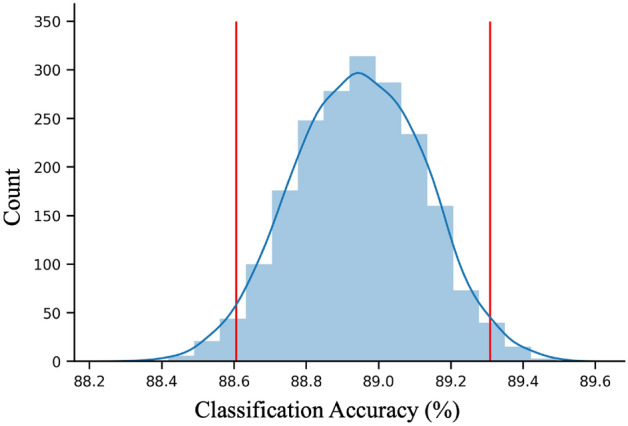
Histogram of mean classification accuracy for hyperalignment of 2000 permutations of random subject order. Red vertical bars demarcate the 95% confidence interval.
Official websites use .gov
A
.gov website belongs to an official
government organization in the United States.
Secure .gov websites use HTTPS
A lock (
) or https:// means you've safely
connected to the .gov website. Share sensitive
information only on official, secure websites.
Histogram of mean classification accuracy for hyperalignment of 2000 permutations of random subject order. Red vertical bars demarcate the 95% confidence interval.