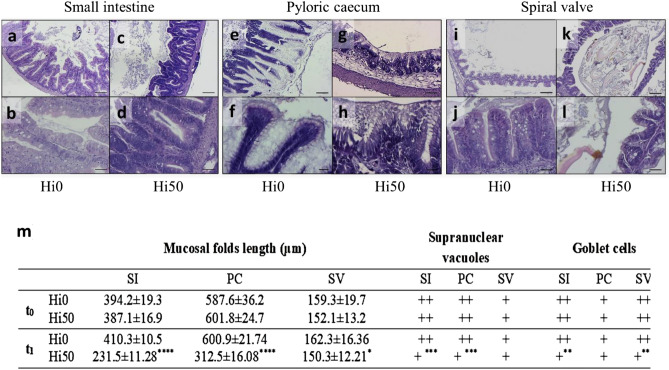
Figure 4.
Siberian sturgeon’ small intestine (SI), pyloric caeca (PC) and spiral valve (SV) histology at t1 and histological indexes (mucosal folds length, supranuclear vacuoles abundance and goblet cells number) calculated in these gut tracts. (a–d) small intestine; (e–h) pyloric caecum; (i–l) spiral valve. Histology scale bars: (a,c,e,g) 100 μm; (b,d,f,h,j,l) 50 μm; (i,k) 200 μm. For histological indexes (m), values are showed as mean ± SD (n = 15). Scores: supranuclear vacuoles + scattered, ++ abundant; goblet cells + 0 to 4 per villus, ++ more than 4 per villus. Significant differences, calculated within the same sampling time, between Hi0 and Hi50 are indicated as follows: ns, non-significant; *p < 0.05; **p < 0.01; ***p < 0.001 and ****p < 0.0001. Sturgeon fed diets including 0 and 50 of BSF meal (Hi0 and Hi50, respectively).

