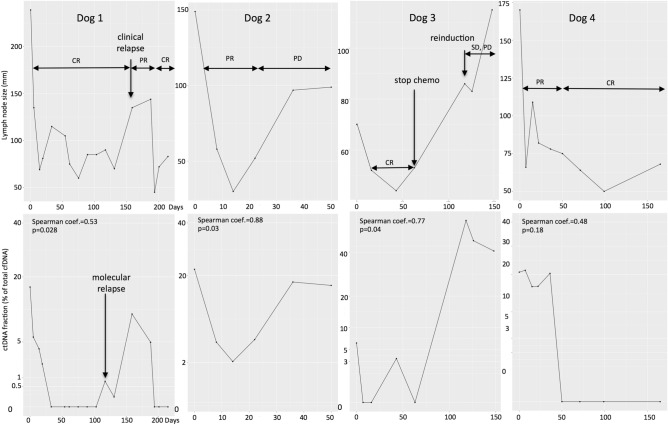
Figure 4.
Course of disease for four dogs with lymphoma that were treated using chemotherapy (dog 1: 18182, dog 2: 18710, dog 3: 18680, dog 4: 18744) (drawing produced by R studio software Version 1.1.463; Vienna, Austria60). For each dog, the figures above represent the tumor burden with lymph node size (sum of longest diameter of at least 2 lymph nodes; in mm). The figures below represent the ctDNA measurement (% of total cfDNA in plasma) during the disease. For each case, a Spearman correlation analysis was performed to assess the correlation between the tumor burden and ctDNA quantity (coefficient and p value). CR complete response, PR partial response, SD stable disease, PD progressive disease.

