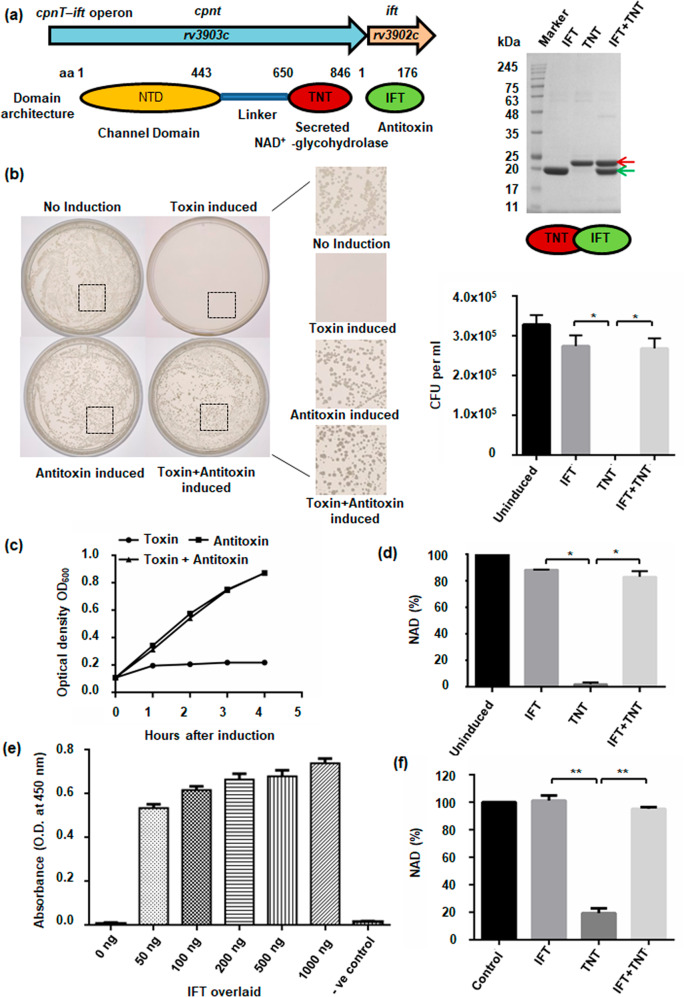
Fig. 1. Endogenous NAD+ levels determine bacterial colony formation and propagation.
a Schematic representation of the cpnT–ift operon of M. tuberculosis along with domain architecture of proteins Cpnt and IFT, and SDS-PAGE analysis of purified recombinant proteins, IFT-His6x (green arrow, molecular weight ~21.6 kDa) and TNT-His6x (red arrow, molecular weight ~24.6 kDa). E. coli BL21 (DE3) cells were co-transformed with IFT-pET28a and TNT-pMTSA plasmids. TNT expression was induced with arabinose while IPTG was used for the overexpression of IFT. b Growth of co-transformed cells on agar plates applied with 0.2% arabinose, or 25 µM IPTG, or both after 16 h of incubation at 37 °C. Control represents growth on agar plate containing antibiotics only. Number of bacterial colonies on agar plates, containing streptomycin and kanamycin supplemented with 0.2% arabinose or 25 µM IPTG or both, were counted. c Optical density at 600 nm was measured in culture induced with arabinose (0.2%) or 1 mM IPTG or both at time zero as well as different time points after that. The result represents mean ± SD for an experiment carried out in triplicate. d Intracellular NAD+ levels of bacterial cells expressing rIFT or rTNT, or both, in comparison to control cells, was determined by an enzyme-coupling assay. e ELISA based confirmation of the interaction between IFT and TNT. Purified recombinant TNT (200 ng) was coated on ELISA plates and overlaid with different amounts of IFT or buffer alone as control and subsequently detected by anti-IFT antibody followed by HRP conjugated secondary anti-mouse antibody. Data represents mean ± SD for experiments carried out in triplicate. f NAD+-glycohydrolase assay of purified rTNT (75 nM) at 200 µM NAD+ concentration in the presence and absence of IFT by the NADH fluorescence method. rIFT inhibits the NAD+-glycohydrolase activity of rTNT. Reaction without rTNT was used as control. NAD+ concentration in the control sample was considered as 100% and other samples were normalized compared to the untreated control sample. P values were calculated using unpaired t-test with Welch correction. *P < 0.05, **P < 0.01, ***P < 0.001. Statistical significance was determined using TNT-treated sample as the control against which other groups were compared.

