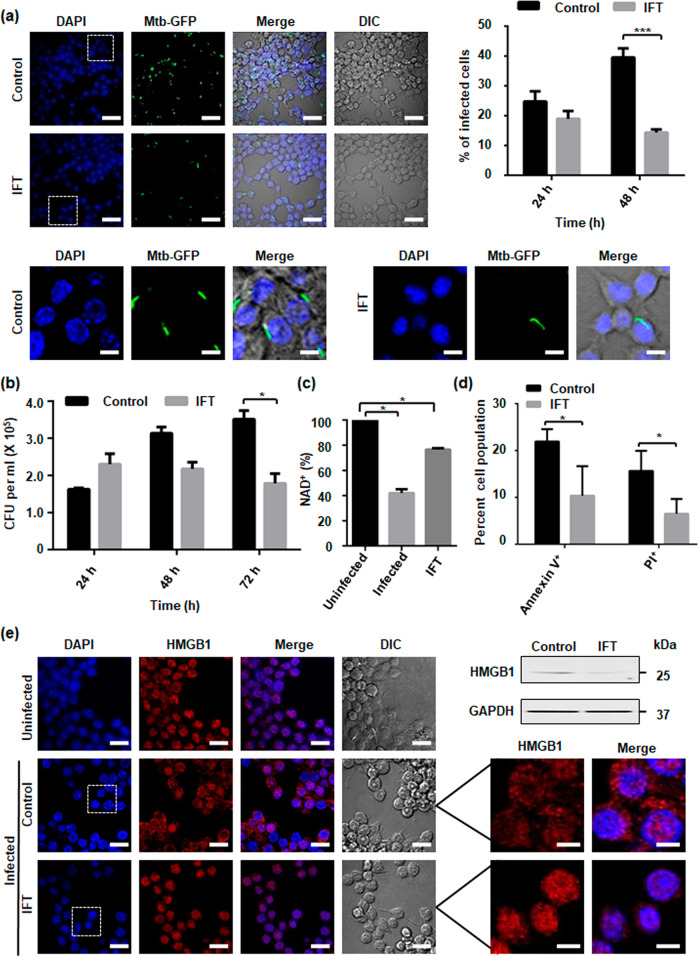
Fig. 3. Host intracellular NAD+ levels mediate M. tuberculosis pathogenesis.
RAW 264.7 cells IFT transfected and control were infected with M. tuberculosis H37Rv or H37Rv-GFP strain at MOI of 10:1 and analysed 48 h after infection or at the indicated time points. a Representative image of confocal microscopic analysis of H37Rv-GFP-infected RAW 264.7 cells. Nuclei were stained with DAPI. Percentages of H37Rv-GFP-infected RAW 264.7 cells expressing IFT were compared to infected control. Significance of difference in percent infection of IFT infected cells with control was calculated using unpaired t-tests with Welch’s correction. ***P < 0.001. Scale bar 50 μm, enlarged image 10 μm. b Viable intracellular bacterial count of M. tuberculosis (colony forming units [CFUs] per millilitre). Decrease in M. tuberculosis intracellular growth from 24 h to 72 h post-infection. *p < 0.05, calculated using unpaired t-tests with Welch’s correction compared with vector alone transfected infected control at 72 h post-infection. Data are representative of three independent experiments. c Intracellular NAD+ content of M. tuberculosis H37Rv-infected RAW 264.7 cells at an MOI of 10:1 after 48 h of post-infection, Relative percent NAD+ level was determined by enzyme-coupling assay in IFT transfected infected cells and control infected cells, in comparison to uninfected cells where NAD+ level of uninfected cell was considered as 100%. The significance of inhibition of NADase activity of M. tuberculosis was calculated by unpaired t-tests with Welch’s correction, *p < 0.05. d Macrophage cell death analysis after 48 h post-infection through flow cytometry by Annexin-V and PI staining of M. tuberculosis infected macrophage cells expressing IFT and compared with M. tuberculosis infected control cells transfected with vector only, *p < 0.05. e Intracellular nucleo-cytoplasmic translocation of HMGB1 in M. tuberculosis infected RAW 264.7 cells transiently transfected with IFT compared to uninfected and M. tuberculosis infected cells using confocal microscopy after 48 h of infection. HMGB1 was immunostained using anti-HMGB1 antibody and a secondary anti-rabbit Alexa Fluor 594 antibody. Scale bar 25 µm. Evaluation of HMGB1 level in the culture supernatant by western blotting. IFT expression protects macrophages from M. tuberculosis induced cell death. Insets show magnifications of cells, highlighting the nuclear and cytoplasmic distribution of HMGB1. Scale bar represents 10 µm.

