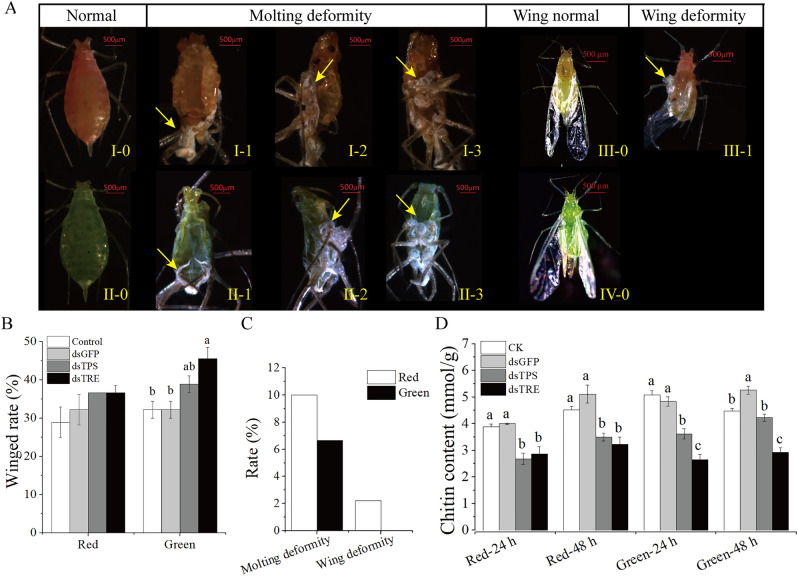
Figure 3.
Effect of RNAi on phenotype and chitin content. (A) Representative phenotypes of A. pisum after RNAi. I-0 and II-0: normal phenotypes as control phenotype; II-3: abnormal phenotypes in the red morphs, the “molting deformity” phenotype; III-3: abnormal phenotypes in the green morphs, the “molting deformity” phenotype; III-0 and IV-0: normal winged and III-1: abnormal phenotype in the red morphs, the “wing deformity” phenotype. All abnormal insects in the nymph-adult stage were present. (B) The winged rate after RNAi. (C) The abnormal phenotype rates. (D) The chitin content after RNAi. Red, red morphs of A. pisum. Green green morphs of A. pisum, CK the normal diet, dsGFP the GFP-dsRNA treatment, dsTPS the TPS-dsRNA treatment, dsTRE the TRE-dsRNA treatment. Each bar represents the Means ± SEM from three biological replicates with ten individuals mixed in each replicate. The data were analyzed using one-way analysis of variance (ANOVA), followed by the Tukey–Kramer test. The different letters above the error bars indicate significant differences (P < 0.05).

