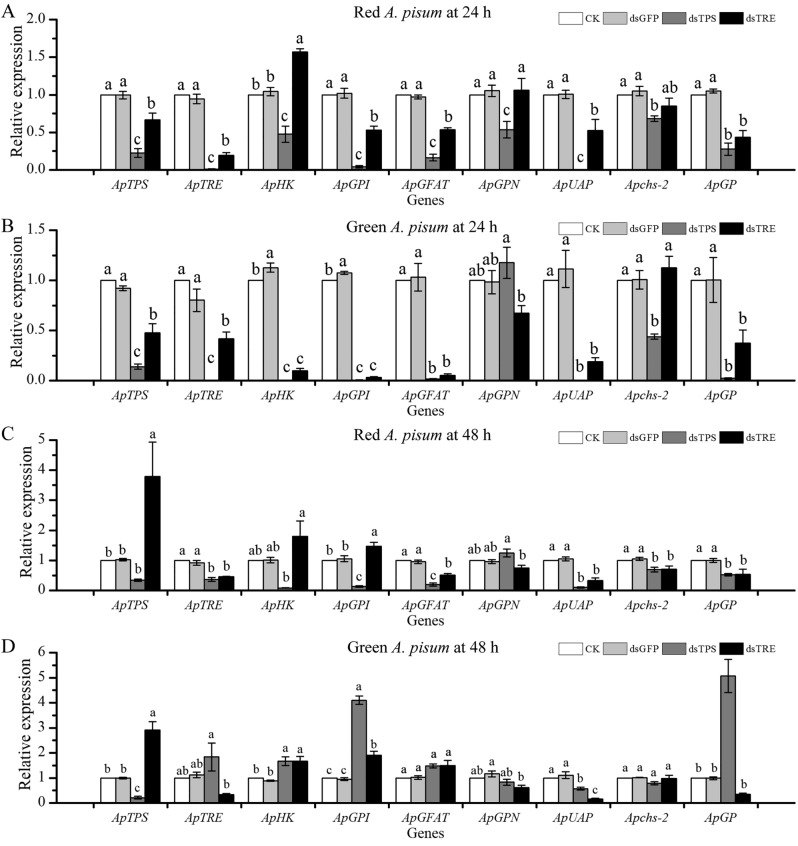
Figure 4.
Effect of ApTPS and ApTRE RNAi treatments on the expression of the gens involved in the chitin biosynthesis. (A) in red morphs at 24 h, (B) in green morphs at 24 h, (C) in red morphs at 48 h, (D) in green morphs at 48 h. CK, the normal diet; dsGFP, the GFP-dsRNA treatment; dsTPS, the TPS-dsRNA treatment; dsTRE, the TRE-dsRNA treatment; ApTPS, trehalose-6-phosphate synthase gene; ApTRE, trehalase gene; ApHK, Hexokinase gene; ApGPI, glucose-6-phosphate isomerase gene; ApGFAT, glutamine-fructose-6-phosphate aminotansferasr gene; ApGPN, glucosamine-6-phosphate-N-acetytransferase gene; ApUAP, UDP-N-acetyglucosamine pyrophosphorylase gene; Apchs-2, chitin synthase gene 2; ApGP, glycogen phosphorylase gene. Each bar represents the Means ± SEM from three biological replicates and three technical replicates. The data were analyzed using one-way analysis of variance (ANOVA), followed by the Tukey–Kramer test. The mRNA expression level in the normal artificial diet group was designated as the reference control for the comparisons. The different letters above the error bars indicate significant differences (P < 0.05).

