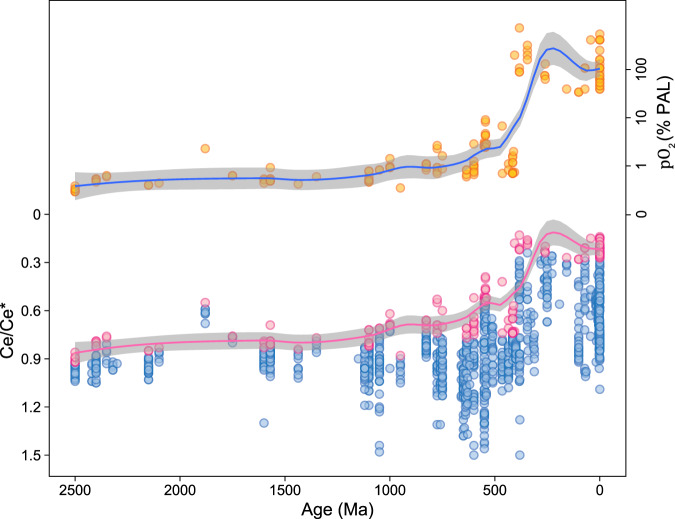
Fig. 2. Estimated partial pressure of atmospheric oxygen and Ce anomaly through Earth’s history.
Lower part: Secular trend of Ce anomaly (Ce/Ce*) for all complied carbonate data with fitting to lowest 10% of the data shown in pink circles. The pink line indicates the best fit for 100 Ma intervals using the Local Polynomial Regression (LOESS) curve fitting method and the gray field indicates the upper and lower bounds based on 95% confidence level. Upper part: Estimated partial pressure of atmospheric oxygen, pO2 (% PAL), through Earth’s history. The blue line shows our best estimate, and the gray field indicates the upper and lower bounds based on 95% confidence level using the LOESS curve fitting method. The pO2 was calculated using the lowest 10% of all carbonate Ce/Ce* data for 100 Ma intervals.

