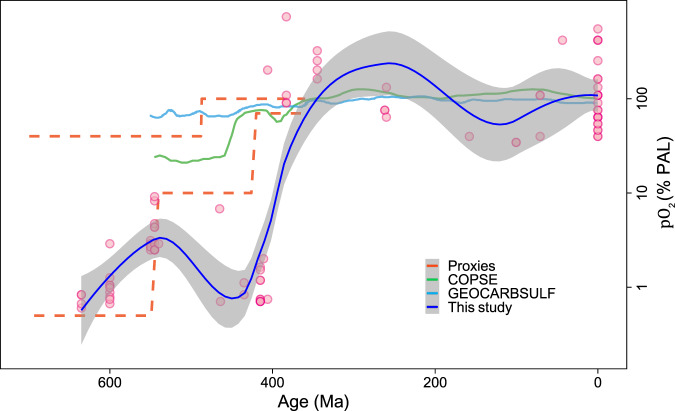
Fig. 3. The estimated partial pressure of atmospheric oxygen level pO2 (% PAL) during the Phanerozoic Eon compared to the results of other studies12,33.
The blue line shows our best estimate, and the gray field indicates the upper and lower bounds based on 95% confidence level using the LOESS curve fitting method. The pO2 was calculated using the lowest 10% of all carbonate Ce/Ce* data for 100 Ma intervals during the Phanerozoic Eon.

