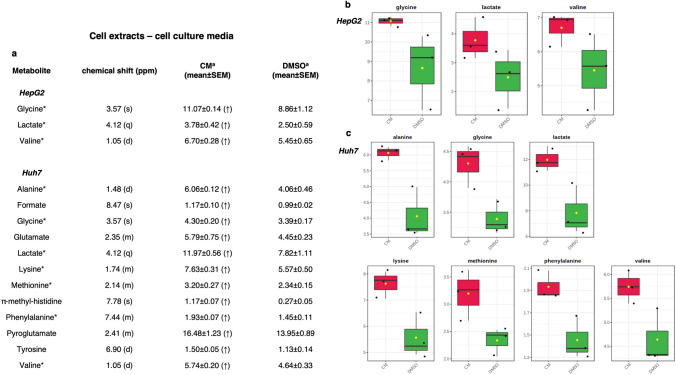
Figure 6.
(a) Quantitative comparison of metabolites found in cell culture media. Mean and relative standard error mean refers to the relative integrals of metabolites, determined from cell culture media 1D 1H-NMR spectra of each group (CM and DMSO treatments). Letters in parentheses indicate peak multiplicities (s, singlet; d, doublet, dd, doublet of doublet; q, quartet, m, multiplet). * A p-value threshold of 0.05 was obtained from t-test analysis. (b,c) Box-and-Whisker plots illustrating the significant metabolites trend grouped according to CM Crithmum maritimum treatment, DMSO Vehicle treatment, derived from the 1H-NMR spectra of (a) HepG2 and (b) Huh7 cell culture media.

