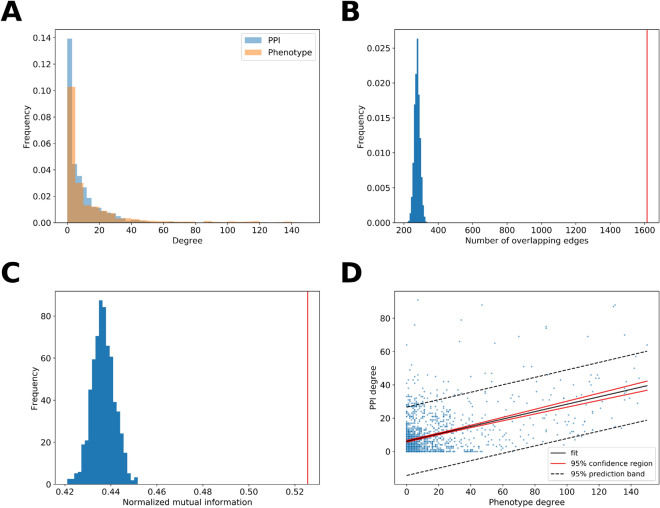
Figure 2.
Similarity of the PPI and phenotype network layers in the epilepsy-autism multiplex network. (A) The degree distribution within each layer of the multiplex network is plotted. (B) There is a significant number of edges overlapping between the PPI network layer and phenotype network layer (p < 0.0001). The distribution represents the number of overlapping edges from 10,000 trials where the PPI network and phenotype network were randomly generated maintaining their original degree distribution. The red line represents the actual number of overlapping edges between the two networks. (C) There is a significant overlap in the modules in the PPI network layer and the modules in the phenotype network layer (p < 0.001). The distribution represents the normalized mutual information from 1000 trials where the PPI network and phenotype network were randomly generated maintaining their original degree distribution. The red line represents the actual normalized mutual information. (D) There is a correlation between the degree of a node in the PPI network layer and phenotype network layer. Each point represents one of the 1707 genes/nodes in the multiplex network.

