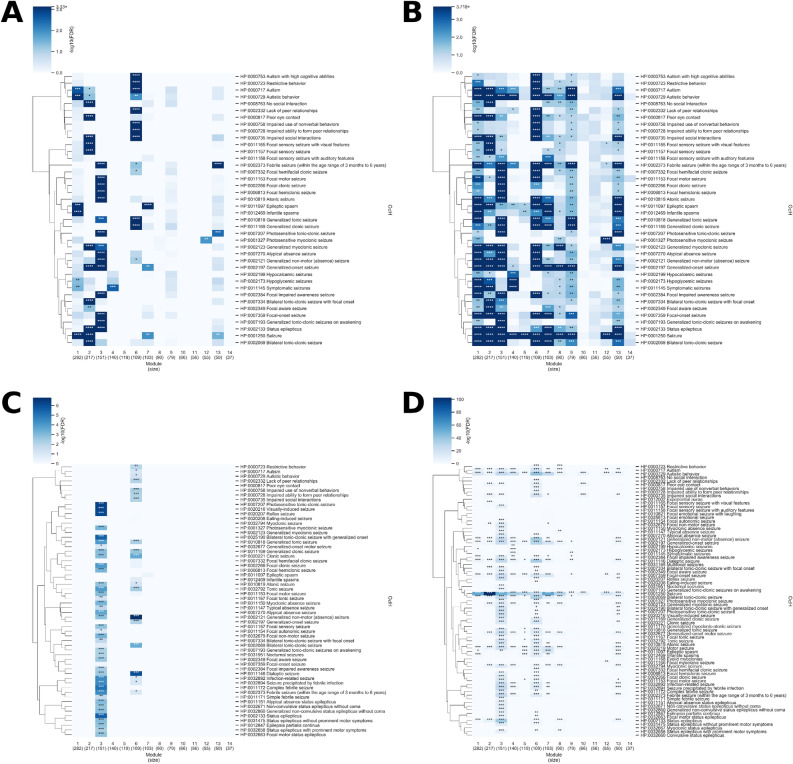
Figure 5.
Enrichment analysis of epilepsy- and autism-related HPO terms for modules in the multiplex network. The enrichment of different epilepsy and autism phenotypes over the 14 largest modules in the epilepsy-autism multiplex network is shown. The first cluster of HPO terms represent autism phenotypes and the rest represent epilepsy phenotypes. Only HPO IDs with gene-HPO relationships in the Phen2Gene knowledgebase are shown. The p-value was determined by computing the mean gene-phenotype association score for each HPO ID over the genes in the module and comparing it to the mean of 10,000 trials using n genes, where n is the size of the module, randomly chosen from (A) the 1707 genes in the multiplex network or (B) all genes in the Phen2Gene knowledge base. (C) and (D) correspond to (A) and (B), respectively, except that the phenotype enrichment was calculated using annotated gene-HPO relationships from hpo.jax.org, The hypergeometric test was used to determine the p-value and the false discovery rate (FDR) is reported. For all plots, the false discovery rate (FDR) is reported since multiple HPO IDs were tested. “****” denotes FDR < 0.0001, “***” denotes FDR < 0.01, “**” denotes FDR < 0.05, and “*” denotes FDR < 0.1. The clustermap was generated using seaborn version 0.10.0 (https://seaborn.pydata.org/). The linkage on the rows was generated based on the distance between HPO IDs in the HPO tree.

