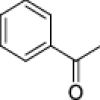
Table 2.
Inhibitory activities of 4b and its derivatives, 4c, 4d, 5b and 6, against ADAMTS-4 and -5.

| ||||||
|---|---|---|---|---|---|---|
| Compound | R1 | R2 | IC50 (μM) QF peptide |
IC50 (μM) V1-5GAG |
||
| ATS4 | ATS5 | ATS4 | ATS5 | |||
| 4b |
|

|
NIa | NIa | NIb | 9.4 ± 2.8 |
| 4c |

|

|
NIa | 57 ± 10 | 90 ± 44 | 62 ± 12 |
| 4d |

|

|
NIa | NI | 180 ± 50 | 90 ± 23 |
| 5b |
|

|
NIa | NIa | 30% inhibition at 100 μM | NIb |
| 6 |
|

|
NIa | NIa | NIb | NIb |
The inhibition of proteolysis was measured using either a short, 12-residue, peptide substrate (QF-peptide) or the protein substrate V1-5GAG. Values are presented as mean ± SEM (n = 3). ATS4, ADAMTS-4; ATS5, ADAMTS-5. NIa, not inhibiting at 50 μM. NIb, not inhibiting at 100 μM (< 10% inhibition compared with the DMSO controls).
