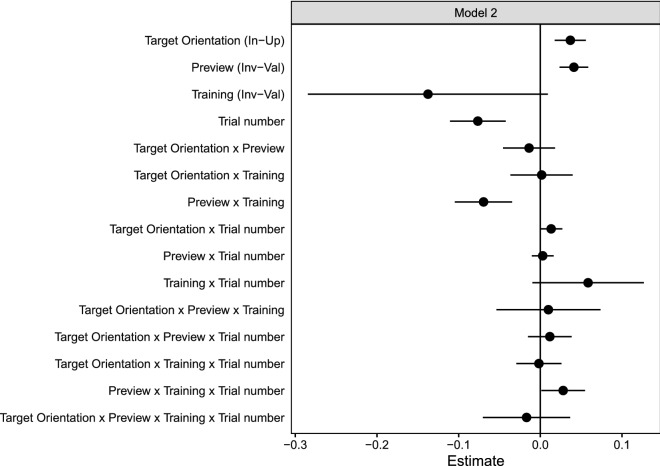
Figure 3.
Fixed effect coefficients of the maximum identified linear mixed model on response times (Model 2). Error bars represent 95% profile confidence intervals. Effect contrasts for each factor are given in brackets next to the names of main effects on the y-axis. In-Up Inverted minus upright, Inv-Val Invalid minus valid. For example, a positive estimate for the Preview effect (invalid minus valid) means that responses were slower for invalid than for valid trials.

