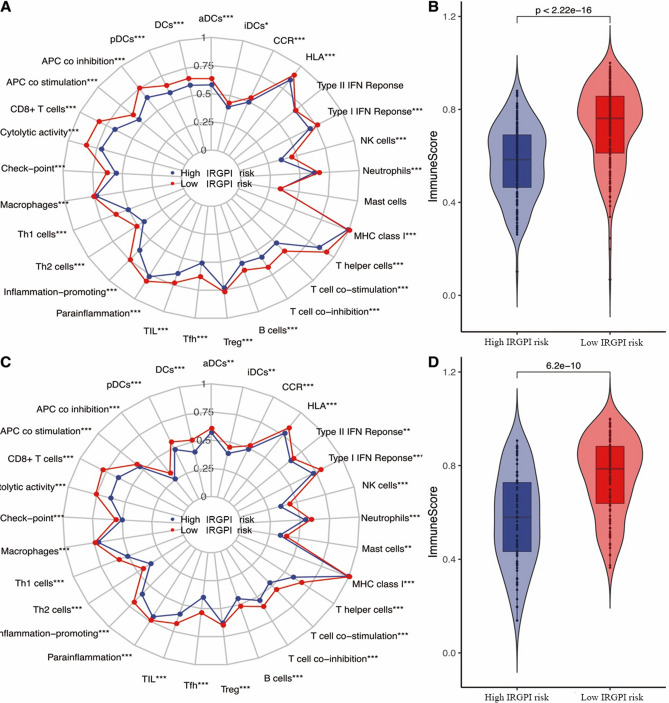
Figure 5.
Tumor immune microenvironment status within differential immune risk groups by using ssGSEA. (A) Summary of the 29 immune cells score of differential immune risk groups in training cohort. (B) The total immune score of differential immune risk groups in training cohort. (C) Summary of the 29 immune cells score of differential immune risk groups in testing cohort. (D) The total immune score of differential immune risk groups in testing cohort. All p values were estimated by t test (*p < 0.05, **p < 0.01, ***p < 0.001).

