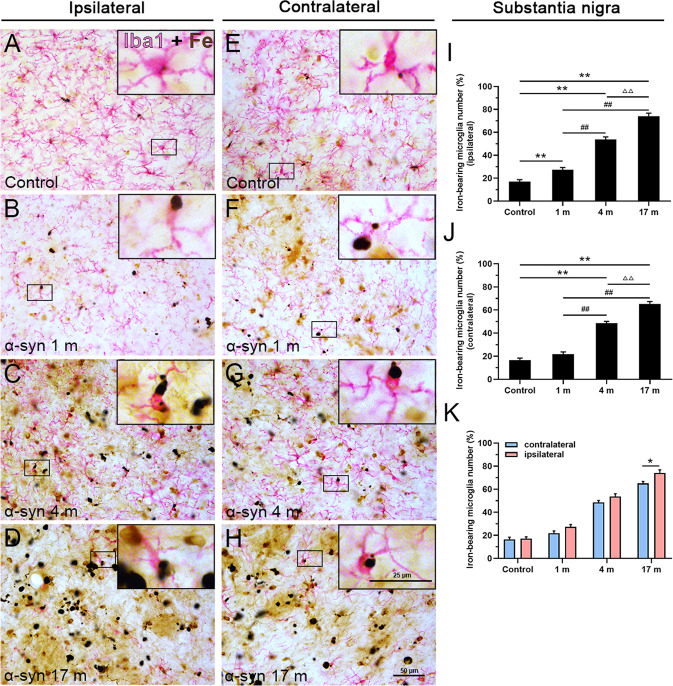
Fig. 5. Cellular localization of iron deposits in microglia of the substantia nigra.
Double-labeling of chemically stained iron ions (dark brown) along with immunohistochemical staining with an Iba1 antibody (magenta) showed overlapping of iron deposition on Iba1-positive microglia in the control group (A) and 1, 4, and 17 months after the treatment with α-syn PFFs in the ipsilateral side (B–D), control group (E), and 1, 4, and 17 months after treatment with α-syn PFFs in the contralateral side (F–H). I–K Quantitative analyses of iron deposition in microglia in the substantia nigra (ipsilateral side: I; contralateral side: J; both sides: K). α-Syn, α-synuclein. The data are presented as the mean ± SEM of three independent experiments. **p < 0.01 vs. control group, ##p < 0.01 vs. 1-month group, ΔΔp < 0.01 vs. 4-month group, one-way ANOVA (I, J). *p < 0.05 vs. contralateral group, Tukey’s multiple comparisons test after two-way ANOVA (K). Scale bars: 50 μm in A–H and 25 µm in the insets.

