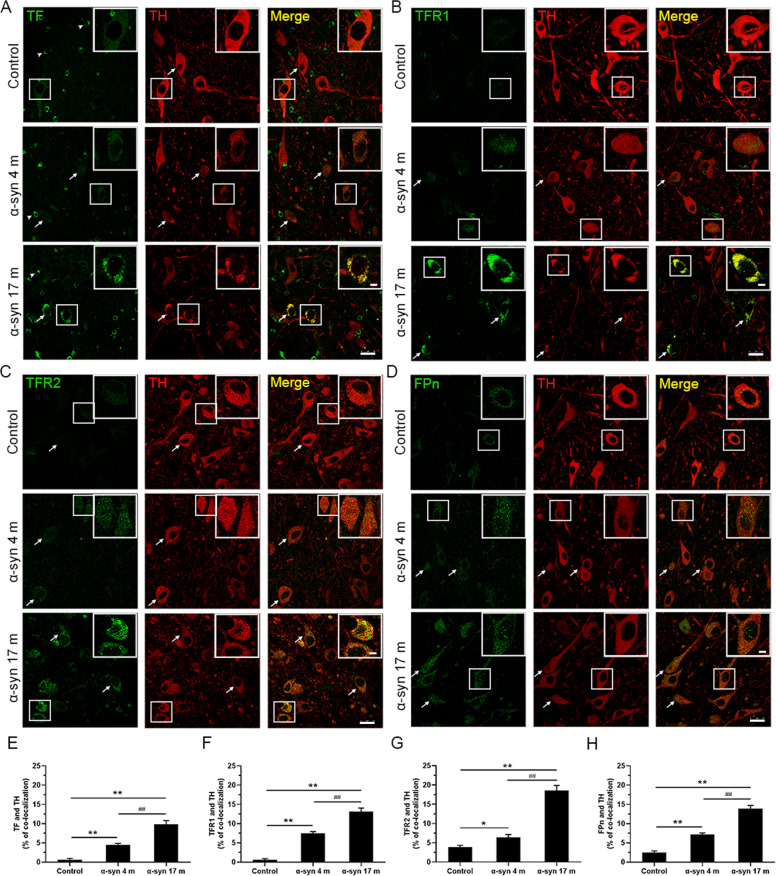
Fig. 7. Double fluorescence images showing the colocalization of TF, TFR1, TFR2, FPn, and TH in dopaminergic neurons in the substantia nigra.
A–D Immunofluorescence intensity of the TF-positive (A), TFR1-positive (B), TFR2-positive (C), and FPn-positive (D) signal increased, while the TH-positive signal decreased 4 and 17 months after α-syn PFFs treatments compared to the control. Arrows show colocalization of TF, TFR1, TFR2, FPn with TH in dopaminergic neurons. Arrowheads (A) show the presence of TF in oligodendrocytes. E–H Colocalizations of TF, TFR1, TFR2, FPn, and TH increased in the substantia nigra after α-syn PFFs treatment. α-Syn, α-synuclein; TF, transferrin; TFR1, transferrin receptor 1; TFR2, transferrin receptor 2; FPn, ferroportin. The data are presented as the mean ± SEM of three independent experiments. *p < 0.05 and **p < 0.01 vs. control group, ##p < 0.01 vs. 4-month group, one-way ANOVA. Scale bars: 25 μm in A–D.

