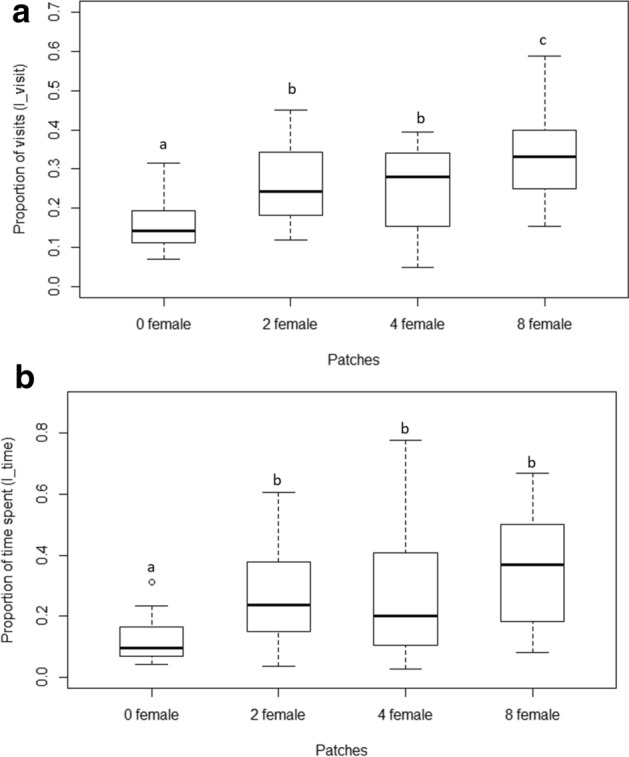
Figure 3.

(a) Boxplots showing the proportion of visits (I_visit) by the male to the various chambers (patches) containing females in varying density. The chamber containing no females received a significantly lesser number of visits compared to the other three chambers. The eight female patch received higher proportion of visits compared to two and four female patches. Differing alphabets indicate statistical significance (p < 0.05), while similar alphabets indicate no statistical difference. The lower and upper ends of the box plots represent the 1st and 3rd quartiles, the horizontal line within each boxplot is the median, and the upper and lower whiskers are the ×1.5 the interquartile range. Outlines are shown as open circles. (b) Boxplots showing proportion of total time (I_time) spent by the male in each of the chambers. Males spent significantly longer time in the three female-containing chambers compared to the chamber with no females. They spent similar proportions of time in 2, 4 and 8 female patches. Differing alphabets indicate statistical significance between the two plots (p < 0.05). The lower and upper ends of the box plots represent the 1st and 3rd quartiles, the horizontal line within each boxplot is the median, and the upper and lower whiskers are the ×1.5 the interquartile range. Outlines are shown as open circles.
